
Introduction
The preceding two briefs in this series considered the measurement of hunger at the household and personal levels in the 2019 General Household Survey and the five waves of the NIDS-CRAM survey conducted between April 2020 and March 2021. This brief develops the analysis by discussing the relationship between household income per capita, poverty and measures of hunger.
Statistics South Africa’s poverty lines
Statistics South Africa makes annual estimates of the levels of three poverty lines. Each is estimated for one individual for a month.
The Food Poverty Line (FPL). This refers to the amount of money that an individual will need to afford
the minimum required daily energy intake.
The Lower Bound Poverty Line (LBPL). This refers to the food poverty line plus the average amount derived from non-food items of households whose total expenditure is equal to the food poverty line.
The Upper Bound Poverty Line (UBPL). This refers to the food poverty line plus the average amount derived from non-food items of households whose food expenditure is equal to the food poverty line.
Table 1 sets out values for these items in April 2019 and April 2020.

Source: Statistics South Africa, National Poverty Lines 2021, Statistical Release P0310.1, 9 September 2021
The General Household Survey
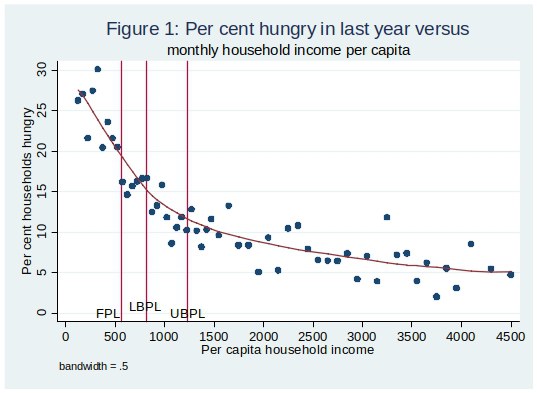
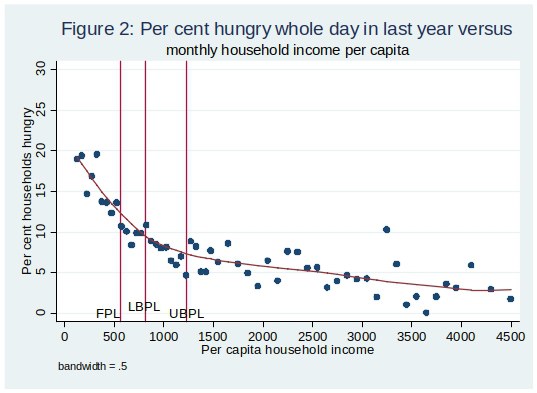
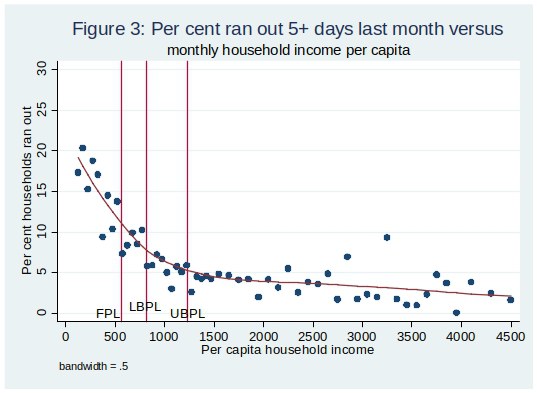
For each household, the GHS records total monthly household income and household size. Monthly household income per capita can be calculated, households can be grouped in income per capita ranges, the proportion of households where hunger has been reported can be calculated for each range, and the results of the calculation displayed in a graph.
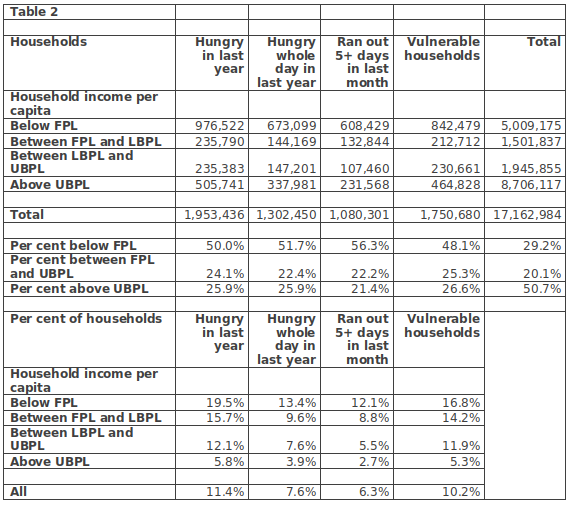
Table 2 displays the relationship between three measures of household hunger and household income per capita, divided into ranges defined by the poverty lines. While, as expected, the percentage of households reporting hunger drops as household per capita income rises for all three measures:
- the percentages in households with reported per capita incomes below the FPL are well below 100%, and
- some households with per capita incomes above the UBPL report hunger.
How can these features be explained?
In the first case, some households with very low money incomes may grow their own food, or receive donations of food in kind. Also it is likely that some recorded very low household incomes are under reports. Some sources of income may not have been captured in the survey, or estimates of some sources by respondents have been too low. In the second case, some households may have had incomes at some point in the reference period which are lower than their incomes at the time of the survey, or they may have wanted to, or had to, finance some expenditure over and above that implicit in the UBPL package.
Figures 1, 2 and 3 display the relationships for household for household per capita monthly income per capita between R 100 and R 4 500.
NIDS-CRAM Wave 4
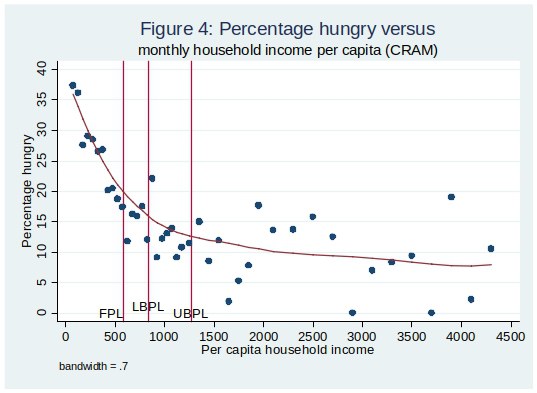
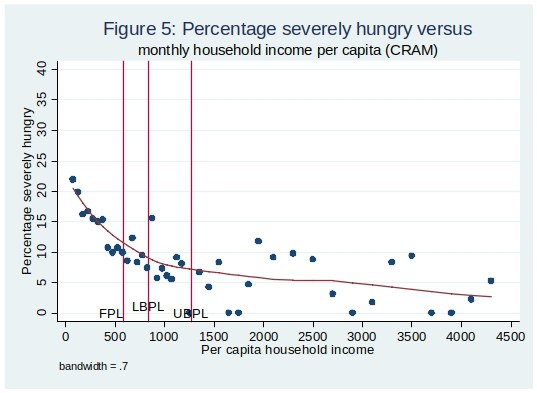
While inferences about households are not possible using NIDS-CRAM data, nothing prevents us from investigating the relationship between hunger and household per capita income among the households about information is collected by the survey. Two measures of hunger are considered: whether or not anyone in a household had suffered hunger in the last seven days, and whether or not anyone in a household had suffered severe hunger (hunger for three days or more) in the last seven days. Figures 4 and 5 present information compiled in the same way as Figures 1 to 3.
Conclusion
One concludes as follows:
- There is no magic number for the size of the social relief of distress grant. Setting it at the FPL, as some suggest, will not get rid of hunger. Not would a basic income grant for everyone between the age of 18 and 59 at the level of the UBPL, leaving aside the difficulties in financing it.
- The diminishing absolute value of the slopes of the fitted curves implies that for a given social relief of distress grant budget, the maximum impact of the grant requires targeting it to members of households with the lowest per capita income.
Accordingly, the next brief will consider eligibility for the social relief of distress grant and its targeting.
Charles Simkins
Head of Research
charles@hsf.org.za
