Method
The table in the Annexure presents monthly estimates of value added in the sectors of the economy covered by monthly production statistics, reconciled to GDP estimates in the first and second quarters. It also presents quarterly estimates of value added in the sectors of the economy not covered by monthly production statistics. Notes on the method of estimation are contained in the Annexure. All calculations are in current prices.
Results
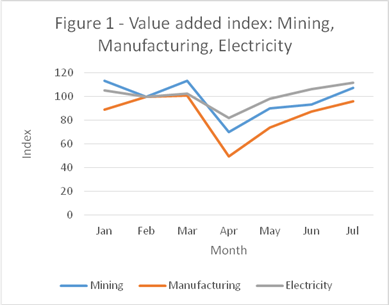
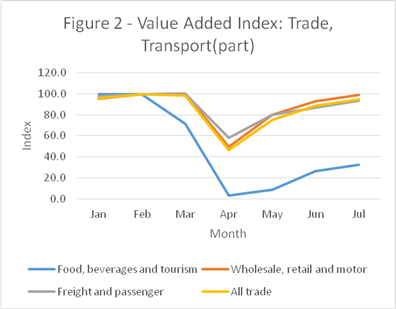
Figures 1 and 2 display the index of value added by covered sector between January and July 2020. In all cases, the index is set to 100 in February, the last full month before the lock down. Table 1 sets out the values of the index in July.
Table 1
|
Sector |
July index |
|
Mining |
107.4 |
|
Manufacturing |
96.2 |
|
Electricity |
111.6 |
|
Trade: Food, beverages and tourism |
32.2 |
|
Trade: Wholesale, retail, motor |
99.0 |
|
Transport |
93.7 |


Table 1 and Figures 1 and 2 show more than full recovery by July to February production in mining and electricity, more than 95% recovery in manufacturing, and wholesale, retail and the motor trade, and 94% in the sector of transport, storage and communication covered by monthly production statistics. The recovery in food, beverages and tourism is far from complete. The lag in this sector is predominantly supply constrained. This is grim for the sector, but value added in it is small, at only 7% of value added in the trade, catering and accommodation sector as a whole in February.
Value added in the sectors covered by monthly production statistics is estimated at 39.0% in the first quarter and 34.3% in the second quarter. What can we say about the uncovered sectors, for which only quarterly value added statistics exist? Table 2 sets out value added in the second quarter as a percentage of value added in the first quarter.
Table 2
|
Sector |
Value added |
|
Agriculture |
140.8% |
|
Gas and water |
94.5% |
|
Construction |
69.9% |
|
Rest of transport, storage and communication |
77.4% |
|
Finance |
92.1% |
|
Government |
99.9% |
|
Personal services |
91.7% |
|
Covered sectors |
76.4% |
Note that the dips in most of the uncovered sectors in the second quarter were much lower than in the covered sectors, with the exceptions of construction and the uncovered part of transport, storage and communication. In both of these sectors, some recovery can be expected in July.
Policy implications
Table 3 sets out the dates by which third quarter data are expected, as well as dates for the October Medium Term Budget Policy Statement and the next meeting of the Monetary Policy Committee meeting.
Table 3
| Event | Date |
| Complete set of August monthly production statistics | 19 October |
| Medium Term Budget Policy Statement | Late October |
| Monetary Policy Committee | 19 November |
| Complete set of September monthly production statistics | 23 November |
| Third quarter Gross Domestic Product statistics | 8 December |
| Complete set of September monthly production statistics | 10 December |
A complete account of the third quarter plus October monthly production statistics will be available just before mid-December. An update to this analysis will be possible then, with a view to determining whether there will be further recovery, a consolidation of the currently observed recovery, or a reverse. A reverse is likely if and when a second wave of the epidemic emerges. This is entirely possible, as the situation in the top twenty countries (excluding the United States) by number of recorded infections indicates (shown in Table 4).
Table 4
|
Status of epidemic |
Countries |
|
First wave rising or near peak |
India, Argentina, Italy |
|
Substantial decline following first wave peak |
Brazil, Colombia, Mexico, South Africa, Chile, Bangladesh, Iraq, Pakistan, Philippines |
|
Second wave approximately as strong as first wave |
Russia, Peru, Spain, France, Iran, United Kingdom |
|
Second wave smaller than first wave |
Turkey, Italy |
In light of the currently available information, the following policy settings may be appropriate:
- Maintain the current level of stimulus, but do not increase it. Monetary policy is expansionary and fiscal policy is highly expansionary, with a primary deficit of 9.7% expected in the 2020/21 financial year.
- Maintain the policy of providing liquidity in the government bond market, but do not embark on quantitative easing.
- Do not increase taxes significantly before at least the middle of 2021/22 financial year, i.e. while a resurge of the epidemic is possible. With luck, vaccination may become widely available in the second half of 2021.
- To provide for the possibility of a second wave of the epidemic, establish a contingency fund to provide again for measures for income support, support to vulnerable households at the current rate, and wage protection at current rates. Continuation of the credit guarantee scheme and support for small and medium enterprises and the informal sector can be continued within the parameters already set.
- Defer consideration of grants to the 18-59 age group until the second half of the 2021/22 financial year. There are many options, such as restriction to a particular age range and various conditions for grants, and these should serve carefully defined objectives. Any programme should be fiscally neutral and compatible with stabilization of the debt to GDP ratio by 2023/24 or 2024/25.
In an uncertain environment, policy has to be developed in the light of emerging data, so the suggested settings are provisional and subject to revision.
Charles Simkins
Head of Research
charles@hsf.org.za
Charles Collocott
Researcher
charles.c@hsf.org.za
Annexure
|
Table |
||||||||||
|
Sectors covered by monthly production series |
||||||||||
|
Production 2020 |
Mining |
Manufacturing |
Electricity GWh |
Food and beverages |
Tourist accommodation |
Motor trade |
Wholesale trade |
Retail trade |
Transport part |
|
|
Jan |
51090 |
168088 |
18444 |
5823 |
2192 |
54522 |
172861 |
84902 |
13803 |
|
|
Feb |
45142 |
189141 |
17491 |
5736 |
2262 |
54833 |
183401 |
87773 |
14078 |
|
|
Mar |
51326 |
190791 |
17976 |
4613 |
1312 |
46619 |
185731 |
92421 |
14112 |
|
|
Apr |
31682 |
93576 |
14357 |
255 |
40 |
8790 |
101674 |
45879 |
8226 |
|
|
May |
40832 |
139770 |
17230 |
756 |
34 |
28349 |
145181 |
80813 |
11304 |
|
|
Jun |
42279 |
165204 |
18649 |
2301 |
105 |
47392 |
171324 |
82801 |
12268 |
|
|
Jul |
48488 |
181917 |
19520 |
2755 |
187 |
51839 |
191024 |
80735 |
13188 |
|
|
Value added 2020 |
Mining |
Manufacturing |
Electricity |
Trade |
Transport part |
Total |
||||
|
Jan |
28172 |
43812 |
6927 |
54000 |
10118 |
143028 |
||||
|
Feb |
24892 |
49299 |
6569 |
56269 |
10319 |
147348 |
||||
|
Mar |
28302 |
49729 |
6751 |
55516 |
10344 |
150642 |
||||
|
Apr |
17703 |
24950 |
5467 |
27389 |
6030 |
81540 |
||||
|
May |
22816 |
37267 |
6561 |
44372 |
8286 |
119302 |
||||
|
Jun |
23624 |
44048 |
7101 |
52143 |
8992 |
135910 |
||||
|
Jul |
27094 |
48505 |
7433 |
55757 |
9667 |
148456 |
||||
| Value added 2020 |
|
Uncovered total |
Total |
Total |
||||||
|
Covered sectors |
Agriculture |
Gas and water |
Construction |
Transport etc. Rest |
Finance |
Government |
Personal services |
current prices |
2010 prices |
|
|
Q1 |
441018 |
28890 |
4111 |
40630 |
73443 |
271902 |
200352 |
70940 |
1131285 |
694032 |
|
Q2 |
336751 |
40675 |
3884 |
28408 |
56872 |
250509 |
200228 |
65084 |
982410 |
599104 |
Q2/Q1 |
76.4% |
140.8% |
94.5% |
69.9% |
77.4% |
92.1% |
99.9% |
91.7% |
86.8% |
86.3% |
Notes
- Mining and Manufacturing: Value added proportional to production, with monthly constant of proportionality adjusted to quarterly value added.
- Electricity: Value added proportional to electricity distributed, with monthly constant of proportionality adjusted to quarterly value added.
- Trade: Composed of five components: food and beverages, tourist accommodation, motor trade, wholesale trade and retail trade. First round monthly value added estimated by production less purchases in each case and five components of value added aggregated. Monthly value added further adjusted to quarterly value added.
- Part of transport: Composed of two components: freight transport and passenger transport. Value added estimated by production less purchases in both cases. Passenger transportation excludes minibus taxis, metropolitan buses and rental of private cars/buses without drivers. Freight transportation excludes renting of trucks without drivers and in-house transportation.

