Public Opinion
In August/ September 2019, foreign nationals have been targeted once again in lootings, arson and assault, following a series of police raids on undocumented migrants in the Johannesburg CBD. Xenophobic violence is typically a response to fear and insecurity, and so it is no coincidence that unemployment statistics came in at 29% this July – the worst levels seen since 2008.
In the 2017 Human Sciences Research Council’s Social Attitudes Survey, 71% of the South African public identified the threat posed by immigrants as the main explanation for anti-immigrant violence. Of the nationally representative sample, most respondents answered that xenophobia is a response to the criminal activities of foreigners (33.1%) or the economic activities of foreigners (39.8%). Within the latter group, 30.3% answered that ‘immigrants increase or cause unemployment’ and 4.7% answered that ‘immigrants use up scarce resources’.[1] These sentiments are reinforced by the sense that a large percentage of immigrants in South Africa are illegal and unfairly benefitting off the back of the nation.
Public opinion is in line with much government policy and discourse that constructs immigrants as scapegoats for high crime, unemployment and the ineffective immigration regime itself. This brief interrogates the underpinnings of South Africa’s bitter xenophobia – a set of stereotypes too often reiterated by government.
1. Immigrants and the economy
We pose four questions:
- How do immigrants fit into the South African economy?
- Do immigrants take South African jobs?
- Do they put downward pressure on decent work standards?
- What is their net contribution to the economy?
1.1. How do immigrants fit into the South African economy?
Findings from the 2018 OECD-ILO study ‘How Immigrants Contribute to South Africa’s Economy’ and the Statistics South Africa (Stats SA) report ‘Labour market outcomes 2012 and 2017 of migrant populations in South Africa’ are combined in the remainder of this brief.
Stats SA divides the population aged 15 and above into three categories:
- Non-movers: people who live in the same province in which they were born
- Internal migrants: people born in South Africa, but live in a different province than the one in which they were born
- Immigrants: people born outside South Africa.
The table below indicates the proportions in each category in 2012 and 2017.
|
Category |
2012 |
2017 |
|
Non-movers |
80.8% |
78.5% |
|
Internal migrants |
15.3% |
16.2% |
|
Immigrants |
3.9% |
5.3% |
|
Total |
100% |
100% |
Source: Stats SA
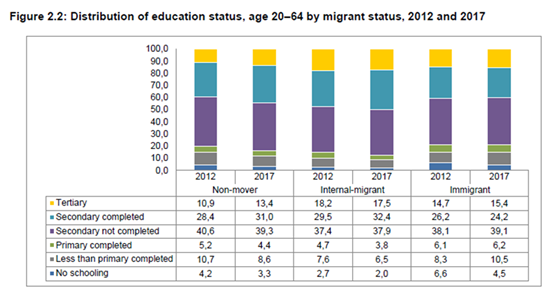
The figure below indicates the distribution of education status within the three groups in 2012 and 2017. Both internal migrants and immigrants have a higher proportion of people with tertiary education than non-movers in both years. In 2017, the proportion of immigrants with at most a complete primary education was higher than among the other two groups. These findings reflect the segmentation of the foreign-born labour force between the high-skilled and low-skilled.
 Source: Stats SA
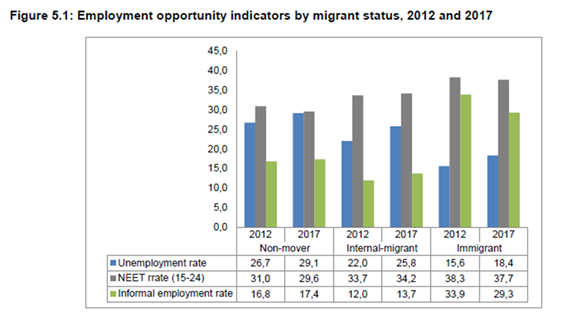
The figure below compares unemployment, the proportion of the 15-24 age group “not in employment, education or training”, and the informal employment rate.

Source: Stats SA
All groups have experienced increased unemployment between 2012 and 2017. But the unemployment rate for immigrants was considerably lower than for other groups in both years. The NEET rate (not in education, employment or training) provides a percentage of youths (15 – 24) who are neither employed nor being educated or trained. Immigrant groups experienced the highest NEET rates in 2012 and 2017. Immigrants have a much higher informal employment rate. In general, immigrants are well-integrated into the South African labour market.
The OECD-ILO report finds that immigrant workers earn on average about 5% less income than South African-born workers, controlling for year, province, sex, broad education level and experience. There is a considerable difference between the foreign-born who have become South African citizens and those who have not. The former group earn 6% more than the South African-born, and the latter group 14% less[2]. This is in keeping with the immigration policy regime (see the second brief) which preferences immigrants with “critical skills” for citizenship.
1.2. Do immigrants take South Africans’ jobs?
The OECD-ILO labour market impact analysis (2018) suggests no significant impact of the presence of immigrant workers on South African-born employment at the national level. However, at the sub-national level, the presence of immigrant workers has both negative and positive effects on the South African-born population. It was concluded further that the presence of “new” immigrants, who have been in South Africa for less than ten years, increases both the employment rate and the incomes of local workers.
This is likely a result of the economic growth associated with immigration (together with the reality that immigrants are more likely to be self-employed and therefore employ South Africans)[3], subsiding in the medium term once the economy has adjusted to newcomers.
Moreover, the evidence suggests that immigrants do not necessarily compete for the same jobs as South Africans. This is in line with South Africa’s critical skills-based immigration policies, but also the “backdoor” phenomenon, by which immigrants are allowed to enter to fill informal sector or low-skilled jobs, but only on a temporary basis and with little job protection.
1.3. Do immigrants put downward pressure on decent work standards?
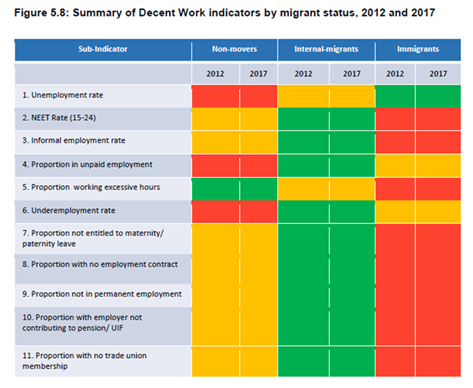
The Stats SA report uses the ILO’s Decent Work Agenda framework to classify immigrant and local labour. Decent work is central in efforts to reduce poverty and is a means for achieving equitable, inclusive and sustainable development. The rates and proportions in the framework indicate undesirable types of work that express lack of job security and stability as well as social security.
Out of the eleven decent work indicators, immigrants performed the worst in eight (red entries in the figure below). In other words, whilst immigrants are more likely to be employed, they tend to participate in “less decent” work than locals. They have a higher NEET rate, a higher rate of employment in the unprotected sector, more excessive hours and fewer benefits. This would suggest immigrants taking low standard jobs are pushing locals in the labour market upwards or outwards. The problem is compounded by the erosion of immigrants’ rights in an increasingly deterrent regime and the fact that when immigrants are irregular, they are not protected by the regulatory regime and can therefore be exploited.

Source: Stats SA
1.4. What is the net contribution that immigrants make to the economy?
Growth
Using a macroeconomic model, the OECD-ILO report found that high-skilled foreign-born workers raise GDP by 2.8% (in comparison with a situation without foreign-born workers), and increase GDP per capita by 2.2% (see Figure 5.7). In terms of employment, high-skilled foreign-born workers raise the number of employed people by 678 000 (consisting of 462 000 additional South African-born workers and 216 000 foreign-born workers). The effects on GDP and employment are greater in the case of medium-skilled and low-skilled workers, due to the greater number of workers in these categories. For example, in 2011 high-skilled foreign-born workers numbered 285 000, compared to 895 000 medium- and low-skilled workers. The effect of medium-skilled and low-skilled immigrant workers on income per capita amounts to 2.8%. The model estimates the immigrant contribution to between 8.9% and 9.1% of national GDP.
Fiscal impact
The table below contains OECD-ILO estimates of per capita public expenditure, public revenue and net fiscal contribution in Rand in 2011.
|
South African-born |
Foreign-born |
|
|
Per capita public expenditure |
18 713 |
16 472 |
|
Per capital public revenue |
14 317 |
26 221 |
|
Per capita net fiscal contribution |
- 4 396 |
9 749 |
With respect to public finance, immigrants have a positive net impact on the government’s fiscal balance. This is because they pay more taxes than locals (income and value added), disproving the assumption that immigrants generate high costs for the public sector (migration policy and implementation, social grants, health care etc.) without generating similar tax revenues.
2. Immigrants and criminality
Gauteng Provincial Police Commissioner Lieutenant-General, Deliwe de Lange, said in 2017 that about 60% of suspects arrested for violent crimes in the province were illegal immigrants.[4] This statement still echoes through the public debate.
Evidence for this statement was not produced. Firstly, the Commissioner refers to ‘violent crime’, but crime statistics released by the South African Police Service (SAPS) do not have a category called ‘violent crime’. Instead, they refer to ‘contact crimes’: murder, attempted murder, sexual assault, aggravated robbery, common robbery, assault with intent to commit grievous bodily harm and common assault. Secondly, SAPS does not release data on the nationality of persons arrested or convicted of crime. Thirdly, in response to a parliamentary question in June 2017[5], the Minister of Justice Correctional Services stated that 11 842 foreign nationals were in prison, of which 1 380 were there solely by virtue of being illegally present in South Africa. This means that only 6.4% of people in South African prisons, either convicted or remanded for other crimes at that time, were foreign nationals. This is below the 7.1% proportion of the population that they constitute. This finding is in line with studies in the United States which have established that immigrants commit crimes at consistently lower rates than native-born Americans.[6]
If officials make statements about an association between immigrants and criminality, these should have a solid empirical grounding. Otherwise they are baselessly inflaming xenophobia.
3. Immigrants and the deportation regime
The public expenditure mentioned above does not include the cost of deportation of undocumented immigrants. In 2012/13, the Department of Home Affairs (DHA) spent a total of R199.9 million on deportation. According to the Institute for Security Studies, numbers were difficult to obtain, but this amount covered physical deportation over and above the R90.7 million spent on Lindela Repatriation Centre.
Lindela is a Bosasa-run holding facility for undocumented immigrants marked with a history of corruption, overcrowding and human rights abuses. Bosasa’s contract, won from the DHA, began in 2007 and terminates in 2020. At the Zondo Commission, former Bosasa employee Frans Vorster revealed that Lindela funds have been syphoned annually into executives’ pockets over the festive season. Bosasa would allegedly buy 2000 extra mattresses for the facility nearing the end of the year and ensure that they were occupied, in order to cash in on the DHA’s ‘per person per night’ fee.[7] Deportation figures linked to the facility are likely inflated by Bosasa corruption. The ANC Women's League has been linked to Lindela through their ownership of Dyambu Trust - a company that began running Lindela in 1996, out of which Bosasa was born.[8]
In 2009, SAPS Gauteng spent over R362.5 million on detecting, detaining and transferring undocumented foreigners to Lindela. This is the most recent deportation figure published by SAPS.
According to annual reports, the DHA had R581.2 million in pending legal claims against it regarding immigration affairs by 2014/15. The DHA has explained that claims ‘arise mainly out of the unlawful arrests and detention of foreigners, as well as damages arising from the department’s failure to timeously make decisions on permits’. According to a DHA official, the department could minimise its court appearances and legal costs considerably if it responded to letters of demand and performed its immigration functions lawfully and efficiently.
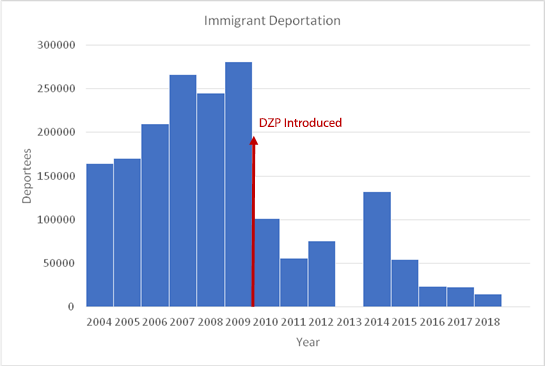
The costs abovementioned are exorbitant. But they encompass costs of corruption within the migration regime and have recently experienced a massive decline. Deportations in 2018 were 5% of those in 2009, owing much to the introduction of the Dispensation for Zimbabweans Permit (DZP) and its subsequent chapters.

Source: DHA Annual Reports 2003 – 2018
Some important conclusions concerning immigration and deportation can be drawn here. The first is that undocumented immigration remains an issue, but need not be the focus of the DHA in every consecutive piece of policy. The second related point is that the public is ill-informed about the costs of the immigration regime, and the current frequency of and expenditure on deportation. Finally, the DHA needs to respond to regional dynamics and immigration flows pre-emptively, through projects like the DZP – which could have saved enormous expenditure on deportation if it hadn’t taken so long to introduce.
Conclusion and Recommendations
It is the nature of xenophobia, and the insecurity at work beneath it, to vilify the “other”. In South Africa, immigrants are constructed as a burden to society with respect to security, jobs and welfare. Their positive contributions to the fiscus, economic growth and per capita income are understated and their contribution to crime appears to have been seriously overstated.
Explored further in the second brief, the current immigration regime erodes the rights and channels of immigrants, pushing them into irregular and exploitative work. Sub-decent work standards and undocumented migration do not benefit locals. In order to leverage immigrants’ skills effectively towards the growth of the economy, legitimate skills-driven immigration need be embraced and regulated. In our globalised world and developing economy, societal buy-in to immigration is vital and something that government should take an active interest in fostering.
Tove van Lennep
Researcher
tove@hsf.org.za
[1] Human Sciences Research Council. 2017 South African Social Attitudes Survey
[2] OECD-ILO, 2018. How Immigrants Contribute to South Africa’s Economy, p103
[3] According to the Stats SA report, 10.7% of period immigrants (immigrants that have moved in the last five years) have their own businesses. Only 6.5% of period internal migrants have their own businesses, while the proportion for locals is even lower. According to international research conducted by The Kauffman Foundation (2014), immigrants started 28.5% of all new businesses in the United States.
[4] Sowetan Live, 14 November 2017. More than half of violent crimes in Gauteng committed by illegal immigrants
[5] Parliamentary Monitoring Group, 23 June 2017. Question NW1615to the Minister of Justice and Correctional Services
[6]Anna Flagg, Is there a connection between undocumented immigrants and crimes, New York Times, 13 May 2019
[7] Mail & Guardian: Bhekisisa, 6 February 2019. This is how SA toddler died at the #Bosasa-run Lindela
[8] News 24, 19 November 2018. Available: https://www.news24.com/Columnists/AdriaanBasson/bosasa-is-the-ancs-heart-of-darkness-20181119

