
Introduction
This brief is the fourteenth in a series discussing developments in production, the labour market and macroeconomic policy since the beginning of 2020.[1] It discusses the September monthly production statistics and it takes a look at rates of profit from the beginning of 2014 to the second quarter of 2020.
Production
Brief 6 pointed out the possibility of a V-shaped recovery in production after the sharp April fall and the available evidence points out that it was virtually complete by the end of September. Table 1 presents estimates of value added by sector based on monthly production statistics and first and second quarter GDP results.
Table 1
|
Value added, current prices |
|||
|
Index (February=100) |
|||
|
July |
August |
September |
|
|
Mining (value) |
109.5 |
128.8 |
142.4 |
|
Mining (output) |
107.4 |
115.1 |
115.3 |
|
Manufacturing |
96.9 |
100.5 |
108.6 |
|
Electricity |
113.2 |
110.4 |
105.6 |
|
Trade |
98.7 |
101.1 |
104.3 |
|
Transport |
92.8 |
98.0 |
98.2 |
|
All (value) |
100.2 |
105.8 |
111.8 |
Table 1 is good news. Mining has not only recovered in output terms, but it has been the beneficiary of increased prices. Manufacturing, electricity and trade have also recovered, with the exception of food and beverage establishments and tourist accommodation (relatively small in terms of value added), where the index of output in September was only 44.8. We shall have to wait for the third quarter GDP results to know what has happened in construction and finance, real estate and business services. The part of the transport, storage and communication sector covered by the monthly production statistics has been a little slower in recovering, but it had very nearly regained the February level by September.
Rates of profit
Statistics South Africa’s Quarterly Financial Statistics series publishes information from enterprise accounts aggregated by sector. Net profit after taxation can be extracted from the data, along with the carrying value[2] of property, plant and equipment and of inventories, representing fixed and working capital at historic cost[3]. Profit rates can be calculated as net profit divided by capital employed, the sum of fixed and working capital.
The financial statistics cover enterprises in the formal business sector of the South African economy, excluding agriculture, hunting, forestry and fishing, financial intermediation and insurance, government and educational institutions.
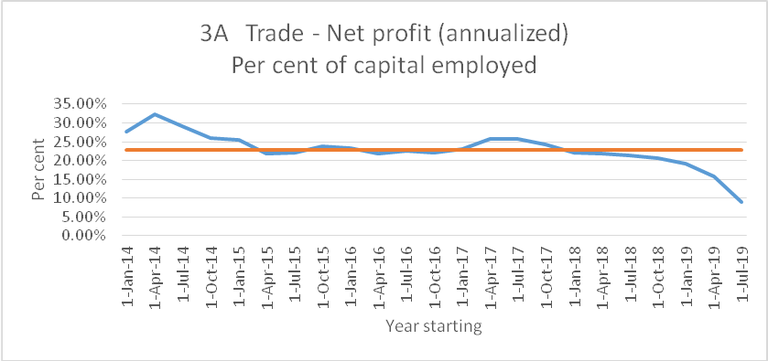
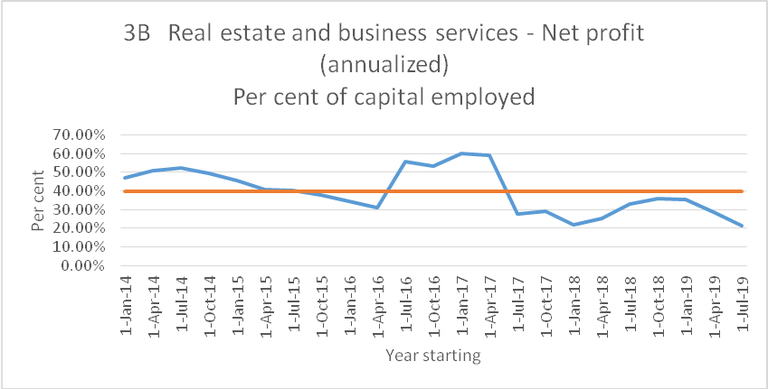
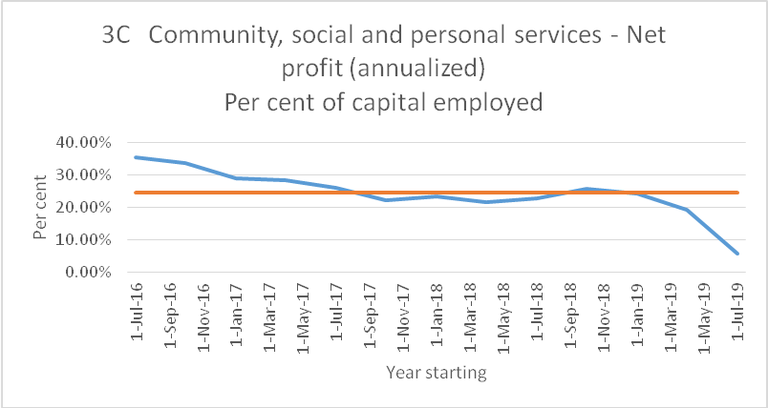
Annual profit rates are calculated for the year beginning 1 January 2014[4], rolling forward by a quarter until the year beginning 1 July 2019 and ending 30 June 2020.
The sectors can be divided into three groups by average annual profit rate:
| Low profit sectors | |
| Mining | 3.0% |
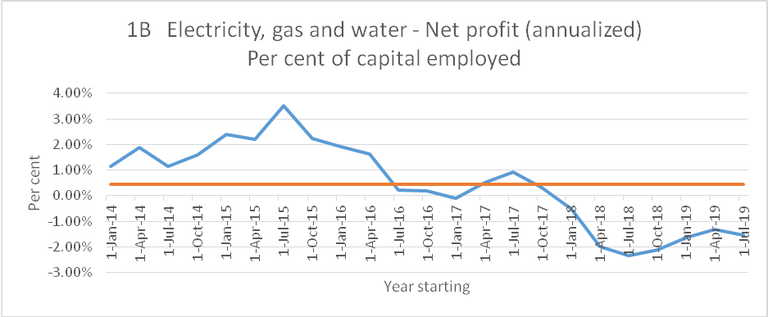
| Electricity, gas and water | 0.4% |
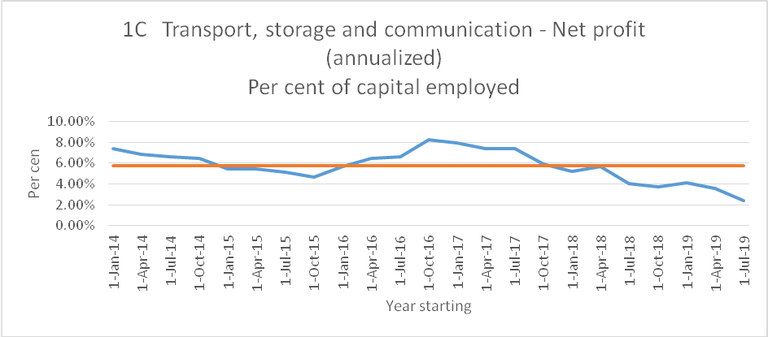
| Transport, storage and communication | 5.8% |
| Intermediate sectors | |
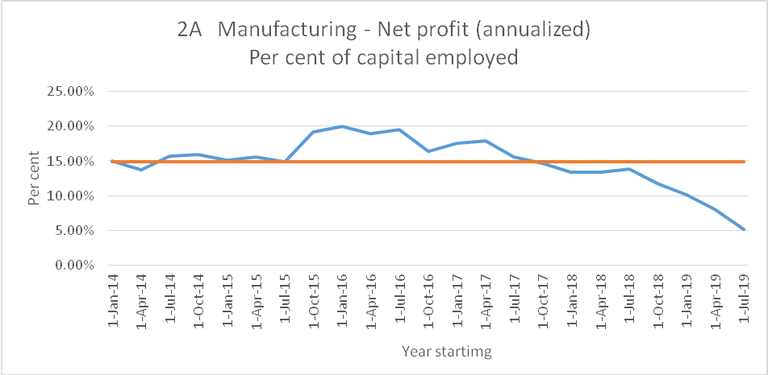
| Manufacturing | 14.8% |
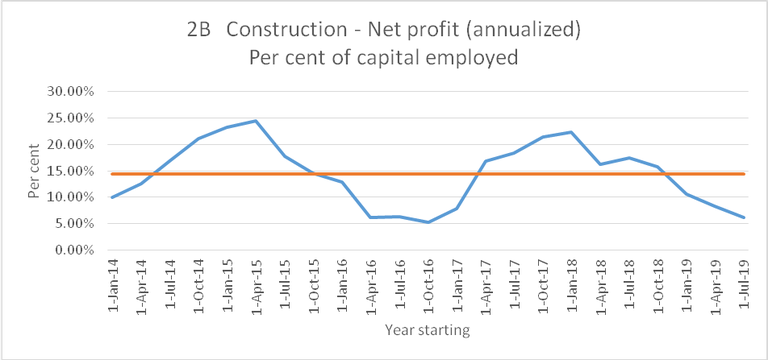
| Construction | 14.5% |
| High profit sectors | |
| Trade | 22.9% |
| Real estate and business services | 39.8% |
| Community, social and personal services | 24.4% |
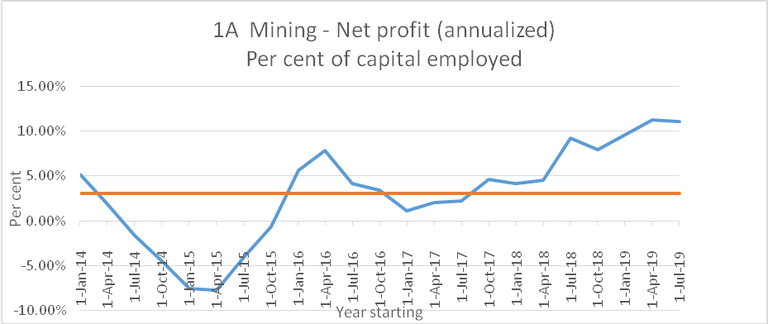
The evolution of profit rates in each sector is shown graphically in the Annexure.
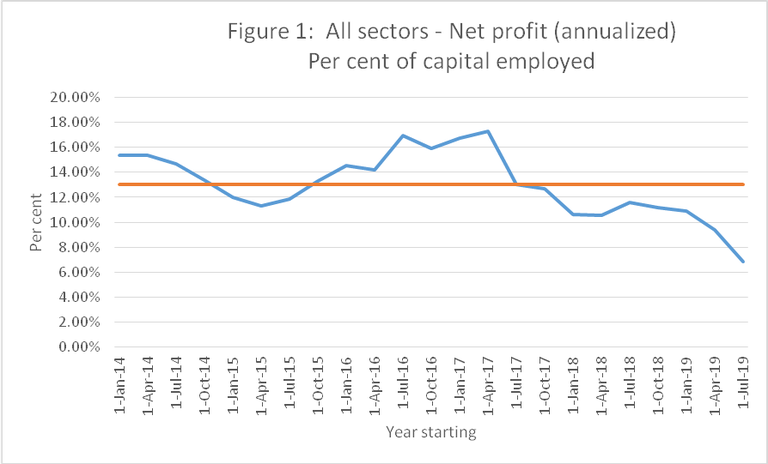
Figure 1 indicates the onset of a profit rate squeeze well before the onset of the COVID epidemic. The epidemic has merely made it worse[5]. This pattern is to be found in all sectors except mining, where recent higher commodity prices have offset, by a narrow margin, losses in 2014 and 2015. Whether, when and how quickly this profit squeeze will be reversed remains to be seen. While it lasts, it will have a depressing effect on investment.
Loanable funds
The National Financial Accounts[6]trace financial flows through the South African economy. In particular, one can identify net lenders and net borrowers of funds.
The three sources of funds (net lending generally positive) are the foreign sector, private corporations and the monetary authority and institutions. The four users of funds are (net lending generally negative) are central and provincial government, local government, public corporations and households. Figures 2A and 2B display the four quarter moving averages covering the period from the first quarter of 2014 to the first quarter of 2020.
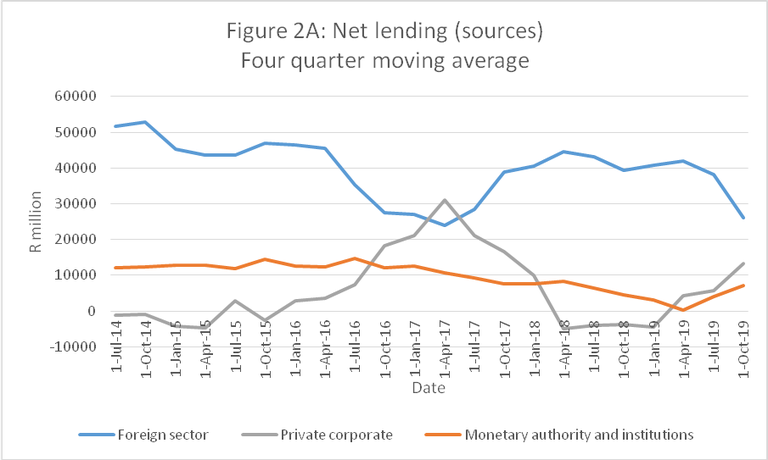
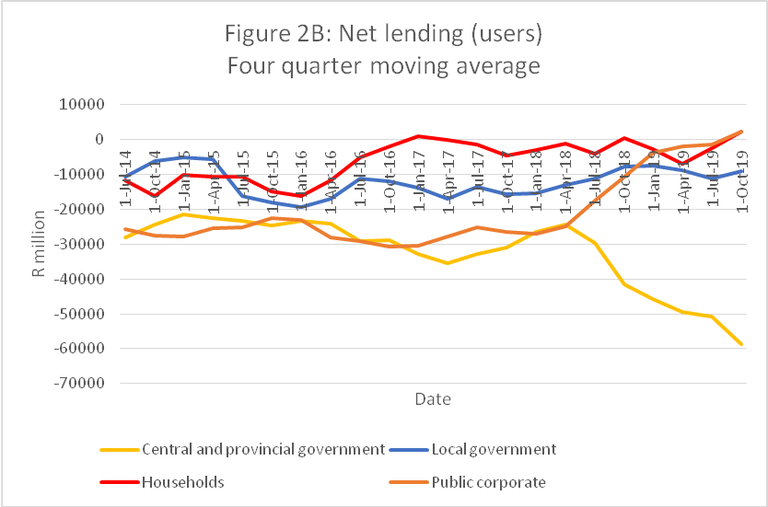
Figure 2A shows how heavily South Africa has relied on foreign lending throughout the period, with some help from the monetary authority and institutions and, in the middle of the period, private corporations. Figure 2B shows the generally increasing extent to which central and provincial government has been a user of funds (borrowing is negative lending), partially offset since 2018 by declining net borrowing by public corporations.
Conclusion
The data show a mix between robustness and fragility. On the one hand, February. On the other hand, a trend towards declining profitability predating the epidemic, and made worse by it, suggests that another hard national lockdown would knock the resilience out of the economythe production data indicate that the private sector has rebounded quickly and fully to where it was in. Whether or when we get a second wave of infections, and how serious that wave will be, depends on a number of factors: behaviour, the weather (summer allows for greater ventilation), and how soon a vaccine arrives on our shores. Financial flows, too, are precarious and a sudden adverse shock from the fiscal system or the foreign sector could see a repeat of March’s disorderly condition in the bond markets, forcing the Reserve Bank to intervene again.
The next brief in this series considers data from the Quarterly Labour Force Survey for Q3 2020.
Charles Simkins
Head of Research
charles@hsf.org.za
Annexure
[1]The thirteen preceding briefs are Charles Simkins, (1) Decision making in a time of uncertainty, 11 June, (2) The Adjustment Budget and beyond, 30 June, (3) Has the Supplementary Budget betrayed the promise of a R 500 billion stimulus package? 15 July, (4) Austerity and a permanent income shock, 15 July, (5) The implications of the second quarter Gross Domestic Product data, 11 September, (6) (with Charles Collocott) July production statistics: an indication of a V-shaped recovery? 28 September, (7) The April to June Quarterly Labour Force Survey: a cautionary note, 30 September, (8) The National Income Dynamics Study’s Coronavirus Rapid Mobile Survey: the labour market in the first and second quarters of 2020, 14 October, (9) August production estimates and April to June Quarterly Employment Statistics, 20 October,(10) How coherent are the 2020 production and labour market data? I – The basis for assessment, 4 November, (11) How coherent are the 2020 production and labour market data? II = The main issues, 4 November, (12) Financing government debt, 5 November, and (13) The political economy of the Economic Reconstruction Plan, 10 November.
[2] The carrying value of an asset is its original cost minus accumulated depreciation.
[3] The alternative to depreciated historic cost valuation of capital employed is current value of assets. The data to carry out the calculation of profit rates on this basis are not available. Current value is likely, on the whole, to be higher than depreciated historic cost, implying lower profit rates.
[4] 2014 was the year from which real GDP per capita has declined.
[5] This correlates with the finding in Brief 6 that gross operating profit, as measured by the national accounts, dropped more steeply than compensation of employees in Q2.
[6] Published in the Reserve Bank Quarterly Bulletin

