Introduction: levels and growth
Valued in current prices, aggregate GDP in the SADC was US $ 687 billion in 2019. Average per capita income was US $ 1 940 per annum. This compares with the European Union, where aggregate GDP was US $ 15 636 billion with an average per capita income of US $ 35 954 per annum, and the United States, where aggregate income was US $ 21 433 billion with an average per capita income of US $ 65 298.
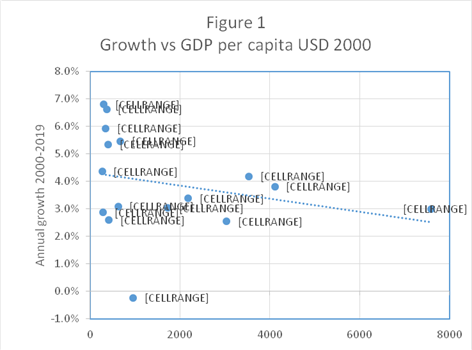
South Africa contributed 51.2% of SADC GDP in 2019, the share having dropped from 60.6% in 2000. Indeed, there has been a modest degree of convergence[1] between 2000 and 2019 across SADC countries as a whole, with poorer countries having grown more rapidly than richer ones over the interval, as illustrated by Figure 1.
There are two ways of valuing GDP in US dollars other than using current exchange rates. The first is to use the World Bank’s Atlas method. The purpose of this method is to reduce the impact of exchange rate fluctuations in the cross-country comparison of national incomes. The Atlas conversion factor is the average of the country’s exchange rate for that year and its exchange rate for the preceding two years, adjusted for the difference between the rate of inflation in that country and international inflation. The World Bank uses GDP per capita to group countries into four categories as shown in Table 1.
The second way is to use purchasing power parity (PPP) dollars rather than exchange rate dollars. As a general rule, consumer prices are higher in more developed than in less developed countries. Valued in PPP dollars, aggregate GDP in the SADC was US $ 1 576 billion in 2019, 2.3 times higher than the exchange rate based measure. As a comparison of living standards, the PPP measure is appropriate and it means that the ratio between the US and SADC levels was 14.7:1 in 2019. The EU GDP per capita in PPP US dollars was $ 44 370 in 2019, so the EU to SADC ratio was 10.0:1.

Source: International Monetary Fund, World Economic Outlook Database, April 2021
Table 1
|
Income per capita category 2019 |
SADC countries |
|
High |
Seychelles, Mauritius |
|
Upper middle |
Botswana, South Africa, Namibia |
|
Lower middle |
Eswatini, Angola, Zambia, Comoros, Zimbabwe, Lesotho, Tanzania |
|
Low |
DRC, Madagascar, Mozambique, Malawi |
Economic structure
Deciphering the economic structure of SADC countries is no easy task. The ideal data set would report up to date value added at basic prices for each one-digit industrial classification and the value of taxes less subsidies on products to yield gross domestic product estimated from the production side. What exists is number of always incomplete data sets, differently aggregated and often yielding different estimates of the same magnitude.
Table 2 in the Annexure sets out estimates of the percentages of GDP in three leading sectors of the economy: agriculture, forestry and fishing, mining and manufacturing. On this basis one can classify the countries as follows:
Table 2
|
Type |
Countries |
|
Agriculture, forestry and fishing largest sector |
Comoros, Tanzania, Mozambique, Malawi, Madagascar |
|
Mining largest sector |
DRC (also has high shares of agriculture and manufacturing) , Angola, Botswana |
|
Manufacturing more than 10% of GDP |
Eswatini, Lesotho, Zimbabwe, South Africa (also has the largest share of finance), Namibia |
|
The holiday islands |
Mauritius (also has more than 10% manufacturing), Seychelles |
|
No clear leading sector |
Zambia |
Income distribution
Table 2 in the Annexure sets out mean per capita household expenditure and estimates of the percentages of the SADC population under the three World Bank poverty lines. Table 3 below summarizes the results:
Table 3
|
Poverty line (2011 US $ PPP per day) |
Monthly equivalent in 2020 Rand |
Per cent of SADC population below line |
|
$ 1.90 |
R 440 |
48 |
|
$ 3.20 |
R 740 |
68 |
|
$ 5.50 |
R 1270 |
82 |
Nearly half, more than two-thirds and more than four-fifths of the SADC population lives under the lowest, middle and highest UN poverty lines.
Happiness
Gross National Product per capita is not the only index of wellbeing. An alternative approach is to conduct sample surveys simply asking respondents to imagine their current position on a ladder with steps numbered from 0 to 10, where the top represents the best possible and the bottom the worst possible life for themselves. The World Happiness Report 2020[2] presents results from 153 countries, including fourteen of the sixteen SADC countries, averaged over the years from 2017 to 2019. Table 4 sets out the SADC results.
Table 4
|
Average score |
Countries |
|
5 and above |
Mauritius |
|
4.5 – 4.99 |
South Africa, Mozambique, Namibia |
|
4.0 - 4.49 |
DRC, Eswatini, Comoros, Madagascar |
|
Below 4 |
Zambia, Lesotho, Malawi, Tanzania*, Botswana*, Zimbabwe |
Happiness is by far the greatest in Mauritius (ranked 49th), followed by South Africa (ranked 109th). On the other hand, Zambia was ranked 141st and Zimbabwe 151st, with unhappiness greater only in South Sudan and Afghanistan. However, based on other data collected, the report found that the scores for Tanzania and Botswana were anomalously low.
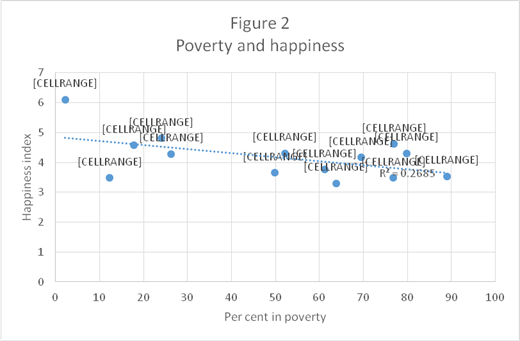
Figure 2 graphs the happiness score against the percentage of people living in poverty across the 14 countries for which happiness data are available. Unsurprisingly, happiness falls as poverty rises, poverty explaining just over a quarter of the variance in happiness. Other determinants of happiness suggested in the World Happiness Report are having someone to count on, having a sense of freedom to make key life decisions, the general level of generosity, and trust.

Conclusion
There is a high degree of poverty and unhappiness among the SADC population, taken as a whole. However, there is economic dynamism in most of the countries, and a range of drivers of growth across them. The COVID-19 pandemic has meant that the SADC economy has suffered a decline of nearly 13% when measured in dollars. Should the SADC economy grow at the same rate between 2021 and 2030 as it did between 2000 and 2019, the situation will be a little better in 2030 than it was in 2019, though it will take decades for poverty to drop to a low level.
Charles Simkins
Head of Research
charles@hsf.org.za
Annexure – Supporting tables
Table 1
|
GDP US $ million 2019 |
GDP per capita US $ 2019 |
Country share (%) |
Atlas method 2019 |
World Bank category |
GDP US$ million PPP 2019 |
GDP per capita PPP 2019 |
|
|
Angola |
89603 |
2815 |
13.1 |
2960 |
LM |
221326 |
6954 |
|
Botswana |
18339 |
7960 |
2.7 |
7650 |
UM |
42685 |
18526 |
|
Comoros |
1190 |
1398 |
0.2 |
1400 |
LM |
2716 |
3192 |
|
Democratic Republic of Congo |
50418 |
581 |
7.3 |
530 |
L |
99312 |
1144 |
|
Eswatini |
4471 |
3895 |
0.7 |
3670 |
LM |
10318 |
8988 |
|
Lesotho |
2289 |
1077 |
0.3 |
1380 |
LM |
5800 |
2729 |
|
Madagascar |
14519 |
538 |
2.1 |
520 |
L |
45499 |
1687 |
|
Malawi |
7663 |
411 |
1.1 |
380 |
L |
20363 |
1093 |
|
Mauritius |
14048 |
11061 |
2.0 |
12900 |
H |
30171 |
23757 |
|
Mozambique |
15195 |
500 |
2.2 |
490 |
L |
40556 |
1336 |
|
Namibia |
12541 |
5026 |
1.8 |
5060 |
UM |
25326 |
10151 |
|
Seychelles |
1580 |
16122 |
0.2 |
16900 |
H |
2817 |
28745 |
|
South Africa |
351354 |
6000 |
51.2 |
6040 |
UM |
761824 |
13010 |
|
United Republic of Tanzania |
60810 |
1048 |
8.9 |
1080 |
LM |
159993 |
2758 |
|
Zambia |
23309 |
1305 |
3.4 |
1430 |
LM |
64607 |
3617 |
|
Zimbabwe |
19273 |
1316 |
2.8 |
1390 |
LM |
42769 |
2920 |
|
All |
686602 |
1940 |
100.0 |
1576082 |
4453 |
Sources
- IMF World Economic Outlook Database, April 2021
- United Nations, World Population Prospects, 2019
- World Bank Development Indicators
Table 2
|
Agriculture share of GDP Per cent 2019 |
Mining share of GDP Per cent 2019 |
Manufacturing share of GDP Per cent 2019 |
Household income per capita US $ PPP 2019 |
Per cent of population in poverty |
Happiness index 2019 |
|||
|
US $ 1.90 PPP 2019 |
US $ 3.20 PPP 2019 |
US $ 5.50 PPP 2019 |
||||||
|
Angola |
6.7 |
19.7 |
7.7 |
3881 |
49.9 |
71.5 |
88.5 |
|
|
Botswana |
1.9 |
18.2 |
5.2 |
9411 |
6.9 |
14.8 |
27.8 |
3.48 |
|
Comoros |
33.1 |
6.8 |
2882 |
13.8 |
31.7 |
56.3 |
4.29 |
|
|
Democratic Republic of Congo |
20 |
28.7 |
14.0 |
826 |
63.3 |
84.3 |
95.5 |
4.31 |
|
Eswatini |
8.5 |
29.0 |
5770 |
29.2 |
52.1 |
73.0 |
4.31 |
|
|
Lesotho |
4.7 |
6.3 |
16.0 |
2173 |
27.2 |
49.9 |
73.2 |
3.65 |
|
Madagascar |
23.2 |
4.1 |
9.1 |
1183 |
55.4 |
73.8 |
87.7 |
4.17 |
|
Malawi |
23.3 |
9.1 |
69.2 |
89.0 |
96.6 |
3.54 |
||
|
Mauritius |
2.9 |
10.9 |
18031 |
0.2 |
2.2 |
12.7 |
6.10 |
|
|
Mozambique |
26 |
9.8 |
9.1 |
891 |
59.6 |
81.8 |
94.5 |
4.62 |
|
Namibia |
7.1 |
9.9 |
11.7 |
7095 |
10.6 |
21.0 |
36.2 |
4.57 |
|
Seychelles |
2.2 |
6.1 |
17333 |
0.5 |
1.1 |
5.2 |
||
|
South Africa |
1.9 |
8.4 |
11.8 |
8456 |
16.4 |
27.1 |
41.2 |
4.81 |
|
United Republic of Tanzania |
26.5 |
4.8 |
8.5 |
1616 |
49.4 |
76.8 |
91.8 |
3.48 |
|
Zambia |
2.9 |
8.1 |
7.6 |
1526 |
46.9 |
65.9 |
82.0 |
3.76 |
|
Zimbabwe |
8.3 |
5.6 |
11.9 |
1922 |
39.5 |
63.8 |
89.8 |
3.30 |
|
All |
7.7 |
10.8 |
10.8 |
48.2 |
68.3 |
82.3 |
||
Sources
- World Bank Development Indicators
- IMF World Economic Outlook Database, April 2021
- United Nations, World Popuiation Prospects, 2019
- World Happiness Report, 2020
- Own calculations
[1] Technically this is known as beta-convergence. Sigma-convergence occurs when there is a reduction in the dispersion of per capita income. If dispersion is measured by the coefficient of variation, then there has been a very small degree of sigma-convergence as well.
[2] Helliwell, John F., Richard Layard, Jeffrey Sachs, and Jan-Emmanuel De Neve, eds. 2020. World Happiness Report 2020. New York: Sustainable Development Solutions Network

