Introduction
Concerns about water quality surface from time to time in South African media. ‘50 000 litres of sewage flow into SA's rivers every second’ was the headline of a Mail and Guardian article on 21 July 2017. ‘In mid-May, independent laboratories discovered that there were unsafe levels of E.coli in Makana’s [Grahamstown] drinking water supply’, reported the Daily Maverick on 21 June 2018. ‘Water quality is poor due to growing pollution caused by urbanization, mining, deforestation and other anthropogenic causes. Water quality in South Africa has been affected by unusual smell and colour properties’ reported the Borgen Project on 10 May 2017.
But what systematic evidence do we have about water quality? And what does it tell us?
The Blue Drop and Green Drop reports
The Department of Water and Sanitation (DWS) started producing Blue Drop reports in 2009. They assessed Water Service Authorities (WSAs), which are local or district municipalities, in six dimensions: water safety planning, process management and control, drinking water quality verification, management accountability and local regulation, asset management, and water use efficiency and loss management. The series indicated steady improvement between 2009 and 2012, but a deterioration between 2012 and 2014. The 2014 report is the most recent one.
Green Drop reports have been published since 2008. They assess waste water management. The overall risk profile of wastewater treatment plants remained reasonably constant over the period 2008 to 2013. However, regress in the performance of municipal treatment facilities is evident for 2014. The 2014 report is the most recent one.
The National Integrated Water Information System
The National Integrated Water System reports on the results of drinking water tests each month[1], starting in 2015, and the information is up to date. Drinking water is regularly tested within each WSA. Water samples are taken from various locations within the distribution system in particular at water sources, at treatment works (at various stages: inflow, before treatment, after treatment), at reservoirs, at distribution points (pump station), and at point of use (house tap).
These samples are then sent to accredited laboratories for formal testing and analysis, and compliance with current Standards (SANS 241) are calculated[2]. The drinking water quality data report, for each WSA, the percentage of tests conforming to:
- Chemistry, as it relates to acute health
- Chemistry, as it relates to chronic health
- Microbiology, as it relates to acute health
- Operational standards
The DWS regards intervention as necessary if the percentage of either of the chemistry tests meeting standards falls below 80%, or if the percentage of satisfactory microbiology tests falls below 95%, or if tests relating to operational standards are less than 70% satisfactory. Accordingly, water quality in a WSA is regarded as unsatisfactory if the percentage in any dimension over a period of 12 months falls below the target standard. Two periods are considered: the first from February 2018 to January 2019, and the second from October 2015 to September 2016. The second period spans the time at which the 2016 Community Survey was taken.
The 2016 Community Survey
The Community Survey (CS) is a large sample survey undertaken between population censuses. Information was gathered from nearly a million households. The CS contains the following information on water:
- The main source of water for drinking
- The distance travelled to obtain water
- Whether the household has access to safe drinking water supply
- The supplier of the main source of drinking water
- Whether there had been an interruption in water supply in the past three months, with cut-offs for non-payment and scheduled water shedding excluded. This question was asked only of households which had a municipal water supply
- If there were interruptions, how long they lasted in total
- If there was an interruption that lasted longer than two consecutive days
- Alternative water source was used during water supply interruption
- Household rating of the overall quality of the water services that it has access to or utilises
Other variables considered are geographical type (urban, traditional or rural), and the type of dwellings in which households reside, and local municipality.
Analysis
1. The NIWIS data indicate a deterioration both in water quality and water monitoring between 2015/16 and 2018/2019. Table 1 presents the comparison.
Table 1
|
Year |
Local municipalities with acceptable water quality |
Local municipalities with unacceptable water quality |
Local municipalities with missing data |
|
2015/16 |
121 |
77 |
15 |
|
2018/19 |
110 |
83 |
30 |
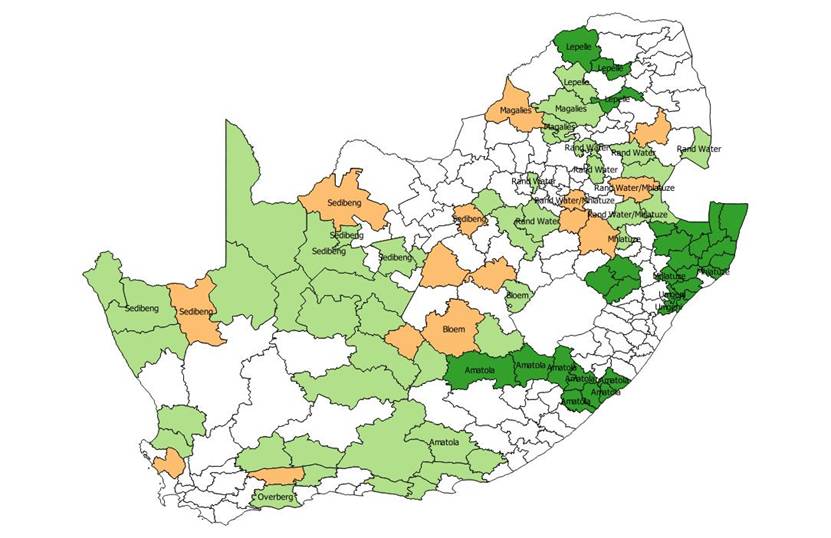
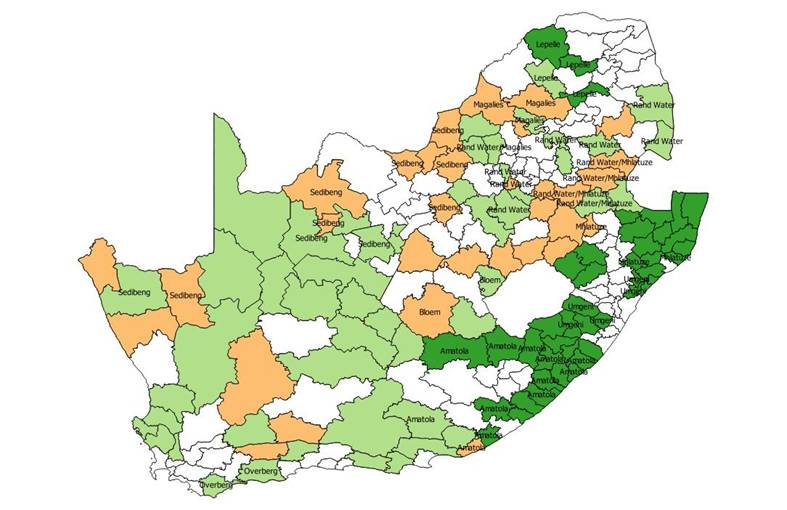
2. The geographic distribution of municipalities with unacceptable municipally supplied water and missing data is similar in both years. Maps 1 and 2 show the distributions in 2015/16 and 2018/19 respectively. The tetrachoric correlation coefficient[3] between 2015/16 and 2018/19 for acceptability or not among municipalities, which have data in both years, is 0.83. 51 municipalities in the Eastern Cape, Northern Cape and KwaZulu-Natal had unacceptable water quality in 2015/16, rising to 56 in 2018/19.
3. The correlates of water quality are ill defined. In both 2015/16 and 2018/19, municipalities with high proportions of households living in traditional areas were, surprisingly, less likely to lack water quality measurements, and in 2018/19 municipalities where the WSA is in financial distress were more likely to lack water quality measurements. In both 2015/16 and 2018/19, the significant determinants of water quality where measured were provinces and water boards, rather than whether the WSAs were district or local municipal or whether they were in financial distress.
Table 2 sets out the distribution of water quality status by local municipality in 2015/16 and 2018/19.
Table 2 – Water quality, 2015/16 and 2017/18
|
Province |
2015/16 |
2018/19 |
Total |
||||
|
Acceptable |
Unacceptable |
Missing |
Acceptable |
Unacceptable |
Missing |
||
|
Eastern Cape (Amatola) |
8 |
9 |
0 |
2 |
14 |
1 |
17 |
|
Eastern Cape (Other) |
11 |
5 |
0 |
8 |
8 |
0 |
16 |
|
Free State |
10 |
4 |
5 |
8 |
3 |
8 |
19 |
|
Gauteng |
8 |
1 |
0 |
8 |
0 |
1 |
9 |
|
KwaZulu-Natal (Umgeni) |
16 |
4 |
0 |
12 |
8 |
0 |
20 |
|
KwaZulu-Natal (Other) |
7 |
17 |
0 |
7 |
16 |
1 |
24 |
|
Limpopo |
15 |
6 |
1 |
17 |
3 |
2 |
22 |
|
Mpumalanga |
7 |
7 |
3 |
7 |
6 |
4 |
17 |
|
Northern Cape |
7 |
16 |
3 |
9 |
12 |
5 |
26 |
|
North West |
15 |
2 |
1 |
8 |
4 |
6 |
18 |
|
Western Cape |
17 |
6 |
2 |
14 |
9 |
2 |
25 |
4. There is a low correlation between water quality as measured by the DWS and water safety as perceived by households in cases where water is supplied by a municipality. The tetrachoric correlation coefficient between the variables is 0.33, significantly different from zero, but low. 9% of households supplied by municipalities with acceptable water quality did not think that their water was safe at the time of the Community Survey, and 82% of households where the quality of water supplied by the municipality was unacceptable regarded themselves as having access to a safe supply.
There are several possible reasons for this:
- The DWS assessments are scientifically based, while household perceptions are not.
- The DWS assessments are based solely on the quality of water, whereas households may take other factors into account when assessing access to safe supply.
- The published DWS assessments are based on a quantitatively unspecified mix of quality measurements at different points in the supply chain. The mix may vary over time and between WSAs.
- Household perceptions are variable within municipalities and may vary systematically across urban, traditional and farming communities
- Household perceptions are based on the quality of water provided at the final points of delivery, whereas the DWS measurements are often taken upstream from these points. Water quality may deteriorate between upstream point and points of final delivery.
5. Household perceptions about whether they have access to a safe drinking water supply service
Table 3 sets out the percentages of households who regard their water supply as safe, by water supplier category.
Table 3
|
Water Supplier |
Percentage of households with access to safe drinking water |
|
Municipality |
86.2% |
|
Other water scheme |
75.5% |
|
A water vendor |
68.2% |
|
Own supply |
71.9% |
|
Flowing water |
51.3% |
|
All |
83.0% |
The table in the Appendix present the results of a logistic regression[4]of perception of access to safe drinking water on a number of variables: dwelling type, water source, distance to water, geographical type, water of acceptable quality (municipal supply and other water schemes only), and interruptions to water supply (municipal supply only).
Briefly, the findings are:
Municipally supplied water. Factors substantially raising the probability of not having access to safe water are principally the nature of the water source, the use of neighbours’ taps, communal taps, and unspecified sources being regarded with particular suspicion. A distance of 200 metres or more LEADS to a greater perception of unsafe water access, as does unacceptable water quality in the municipality as a whole.
Other water schemes. Other water schemes are most frequently found in farming areas, where 18% of households are supplied by them. In traditional areas, 9% are supplied by them, and in urban areas less than 2%. The pattern of perception of safety in relation to them is much the same as that for municipally supplied water. The coefficient of more than one in traditional areas probably reflects less demanding standards for perception of safety there.
Water vendors, own supply and flowing water. Here rainwater tanks in yard, water vendors, boreholes outside yard, flowing water, wells and springs are regarded unfavourably, and the effect of distance to water is stronger.
Conclusions
- The low correlation between acceptability as measured by scientifically analysed water sample and safety as perceived by households leads to great uncertainty as to what the situation actually is. Which source is to be trusted? On the one hand, scientific analysis is to be preferred to assessment based on colour, smell and taste. On the other, water samples are taken from a number of points along the supply chain, whereas households will base their assessment on water at the point of consumption. Moreover, scientific analysis is carried out only for municipal and other schemes and results are aggregated for municipalities as wholes. Households, on the other hand, will make assessments based on conditions in smaller areas. The situation is rendered more obscure by the lack of Blue Drop reports after 2014.
- A rational approach to the scientific testing of water quality would start with monitoring at points of consumption. Water found to be of unacceptable quality at these points would trigger backwards testing – to reservoirs, water leaving treatment plants, water arriving at treatment plants, and the ultimate source of water. Reporting of water quality should be tabulated by the point in the supply chain at which the water is collected.
- The public should be informed of all but the most fleeting lapses in water quality and given advice on how households can cope with these lapses. This would apply to municipal and other water schemes from which 89% of households obtain their water. Additionally, a programme of testing the water accessed by the remaining households could provide clues about how to improve the quality of the water they consume.
- The metros can and do look after themselves. It is in other parts of the country that the problems are to be found.
Charles Simkins
Head of Research
charles@hsf.org.za
Appendix
Table 1 - Access to safe water
|
Logistic regression |
|||
|
Municipal supply |
Community supply |
Water vendor, own supply, flowing water |
|
|
Dwelling type |
|||
|
Formal |
Omitted |
Omitted |
Omitted |
|
Informal backyard |
0,952 |
0,842 |
0,536 |
|
Informal elsewhere |
0,820 |
0,834 |
0,710 |
|
Traditional |
0,934 |
0,765 |
|
|
Other |
0,878 |
0,779 |
0,786 |
|
Geotype |
|||
|
Urban |
Omitted |
Omitted |
Omitted |
|
Traditional |
0,882 |
1,151 |
0,748 |
|
Rural |
1,402 |
||
|
Water source |
|||
|
Piped in dwelling |
Omitted |
Omitted |
Omitted |
|
Piped in yard |
0,821 |
1,127 |
0,777 |
|
Community stand |
0,743 |
0,895 |
0,423 |
|
Borehole in yard |
0,757 |
||
|
Rainwater tank in yard |
0,189 |
||
|
Neighbour's tap |
0,566 |
0,624 |
0,417 |
|
Public/communal tap |
0,615 |
0,699 |
0,402 |
|
Water carrier/tanker |
0,320 |
0,491 |
0,227 |
|
Borehole outside yard |
0,319 |
||
|
Flowing water |
0,026 |
||
|
Well |
0,050 |
||
|
Spring |
0,053 |
||
|
Other |
0,341 |
0,354 |
0,261 |
|
Distance to water |
|||
|
Less than 200 metres |
Omitted |
Omitted |
Omitted |
|
200-500 metres |
0,672 |
0,656 |
0,549 |
|
500-1000 metres |
0,614 |
0,501 |
0,469 |
|
More than 1 kilometre |
0,561 |
0,469 |
0,412 |
|
Water interrupted in |
|||
|
last three months |
|||
|
No |
Omitted |
||
|
Yes - up to 2 consecutive days |
|||
|
Yes - more than 2 consecutive days |
0,883 |
||
|
Unacceptable water quality |
|||
|
No |
Omitted |
Omitted |
|
|
Yes |
0,509 |
0,033 |
|
|
Pseudo-R squared |
0,029 |
0,033 |
0,364 |

Map 1 – Municipal water quality, 2015/16
Key
Dark green – Municipalities with unacceptable water quality where the district municipality is the WSA
Light green - Municipalities with unacceptable water quality where the local municipality is the WSA
Orange – Municipalities with missing data

Map 2 – Municipal Water quality 2018/19
Key
Dark green – Municipalities with unacceptable water quality where the district municipality is the WSA
Light green - Municipalities with unacceptable water quality where the local municipality is the WSA
Orange – Municipalities with missing data
[1] The data can be accessed at http://niwis.dws.gov.za/niwis2/
[2] Department of Water and Sanitation, personal communication
[3] A tetrachoric correlation coefficient indicates correlation when the variables are binary: acceptable/unacceptable, in this case. A coefficient of zero means no correlation and s coefficient of one indicates perfect correlation.
[4] A logistic regression calculates odds ratios for the values of each variable. The odds ratio is the ratio of the odds of the dependent variable (access to safe water) when values are present to the odds when values are absent. An odds ratio of less than one means that the value of the variable concern has a depressing effect on the probability of a positive outcome for the dependent variable (here access to safe water), and an odds ratio of more than one has the converse effect. For technical reasons, one value for each variable has to be omitted.

