Elections since 2000
Since the formation of the Movement for Democratic Change (MDC) in 1999, the main political competition has been between it and the Zimbabwe African National Union – Patriotic Front (ZANU-PF). Table 1 sets out electoral outcomes since 2000.
Table 1 - Election outcomes
|
Date |
Type |
Zanu-PF |
MDC-T |
MDC-other |
MDC total |
Others |
|
2000 |
National Assembly |
48,6 |
47,0 |
3,4 |
||
|
2002 |
President |
56,0 |
42,0 |
2,0 |
||
|
2005 |
National Assembly |
59,6 |
39,5 |
0,9 |
||
|
2005 |
Senate |
73,7 |
20,3 |
6,0 |
||
|
2008 |
President - 1st round |
43,2 |
47,9 |
8,9 |
||
|
2008 |
President - 2nd round |
85,5 |
9,3 |
|||
|
2008 |
National Assembly |
45,9 |
42,9 |
8,4 |
2,8 |
|
|
2008 |
Senate |
45,8 |
43,0 |
8,6 |
2,6 |
|
|
2013 |
President |
61,8 |
34,4 |
2,7 |
1,1 |
|
|
2013 |
National Assembly |
62,4 |
30,3 |
4,7 |
2,6 |
|
|
2013 |
Senate |
61,7 |
35,0 |
3,3 |
0,0 |
Source: Wikipedia
Since 2008, the MDC has been split with the Tsvangirai section retaining the majority of MDC support throughout.
Zimbabwe is not known for free and fair elections. All observers, except the Organization for African Unity (now the African Union) found that the 2002 presidential election was not free or fair. And in 2008, the MDC candidate, Morgan Tsvangirai obtained more votes than Robert Mugabe in the first round, but political violence followed and Tsvangirai withdrew from the second round, describing it as a violent sham and saying that his supporters risked being killed if they voted for him. The continuation in office of Mugabe from 2002 to 2013 was deficient in democratic legitimation. Both elections took place in difficult economic circumstances. In 2002 real GDP per capita was falling fast and in 2008 hyperinflation reached its peak.
The outcome of the 2008 parliamentary elections was the formation of a government of national unity which lasted until the 2013 elections.
The fairness of the 2013 elections was also called into question, though it is difficult to avoid the conclusion that there was a swing away from the MDC to ZANU-PF. Real per capita GDP was 56 percent higher than it had been in 2008 and inflation in 2013 was almost zero. Some of the willingness of voters to support the MDC must be regarded as a protest against worsening economic conditions.
Political sociology
The information in this section is taken from the Afrobarometer Round 6 Zimbabwe Survey, administered in 2015[1]. The Survey had two questions on political affiliation. The first asked whether the respondent felt close to a political party and, if so, which one. The second asked which party the respondent would support if a presidential election were to be held on the next day. 86 percent of respondents who identified a party in the second question identified a party in the first question. The second question contains more information about affiliation than the first and it will be used in what follows.
Table 2 sets out the pattern of affiliation in urban and rural areas. Support is close to evenly split between ZANU-PF and MDC-T in urban areas, but in rural areas, the support for ZANU-PF is three times as strong as that for MDC-T.
Table 2 - Party support, 2015
|
Party |
Urban |
Rural |
Total |
|
Zanu-PF |
29 |
54 |
44 |
|
MDC-T |
26 |
17 |
21 |
|
Others |
4 |
1 |
2 |
|
Would not vote |
9 |
3 |
6 |
|
Refused to answer |
29 |
21 |
24 |
|
Don't know |
3 |
4 |
3 |
|
Total |
100 |
100 |
100 |
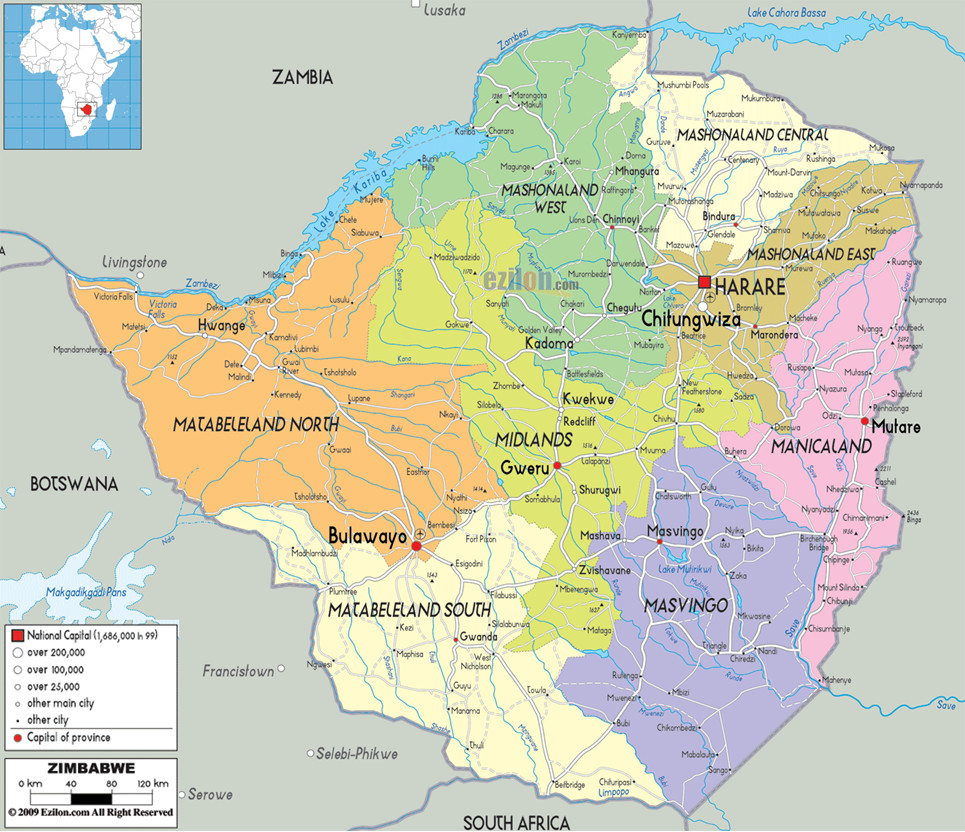
Nonetheless, 53 percent of the support for the MDC-T is found in the rural areas, unevenly spread by province as Table 3 shows. The support for the MDC-T is considerably higher outside the three Mashonaland provinces. This is despite the violent confrontation and repression in Matabeleland in the 1980s, and surveillance and control of political opposition in rural areas since then.
Table 3 – MDC-T: rural support
|
Province |
Per cent |
|
Matabeleland South |
31 |
|
Harare |
27 |
|
Manicaland |
26 |
|
Masvingo |
20 |
|
Midlands |
18 |
|
Matabeleland North |
18 |
|
Mashonaland East |
15 |
|
Mashonaland Central |
9 |
|
Mashonaland West |
5 |
A less repressive environment would see MDC rural support increase, quite possibly with rising differentials across provinces.
The median age of ZANU-PF and MDC-T supporters in the urban areas is the same: 32. The median age of ZANU_PF supporters in the rural areas is 41, compared with 35 for MDC-T supporters.
Table 4 indicates higher average educational levels among MDC-T supporters in both urban and rural areas.
Table 4 - Educational levels among ZANU-PF and MDC-T supporters
|
Urban |
Rural |
|||
|
Per cent |
ZANU-PF |
MDC-T |
ZANU-PF |
MDC-T |
|
Incomplete school |
33 |
20 |
75 |
53 |
|
Complete school |
48 |
42 |
22 |
39 |
|
Post-school |
19 |
38 |
3 |
8 |
|
Total |
100 |
100 |
100 |
100 |
Finally, Table 5 indicates the status of ZANU-PF and MDC-T supporters in respect of wage employment. MDC-T supporters are more likely than ZANU-PF supporters to be in part-time or full-time work in the urban areas, while it is the other way round in rural areas. Given the education differentials, it is helpful to be known as a ZANU-PF supporter
Figure 1 – Zimbabwe provincial map

Table 5 - Cash employment status
|
Urban |
Rural |
|||
|
Per cent |
ZANU-PF |
MDC-T |
ZANU-PF |
MDC-T |
|
Not looking |
29 |
21 |
50 |
42 |
|
Looking |
38 |
30 |
21 |
36 |
|
Part-time employed |
11 |
16 |
11 |
11 |
|
Full-time employed |
22 |
33 |
18 |
11 |
|
Total |
100 |
100 |
100 |
100 |
|
Unemployment rate |
54 % |
38% |
42% |
62% |
The unemployment rate is high everywhere and there is underemployment, to an unknown extent, among part-timers who would prefer full-time work.
Given Zimbabwe’s political history, there is a large difference in perceptions of the political system between supporters. 76 percent of MDC-T supporters regarded Zimbabwe as not a democracy or a democracy with major problems, compared with 25 percent among ZANU-PF.
Possible ways forward
Robert Mugabe did whatever it took to remain in power for 37 years: repression in Matabeleland, land seizure from white farmers, electoral manipulation, violence against opponents and working around a government of national unity when forced to constitute one. The new President, Emmerson Mnangagwa has been complicit throughout, and may very well simply continue the tradition.
But Mnangagwa faces new challenges, particularly on the economic front. Further deterioration in GDP per capita is likely to enhance the appeal of the opposition. He faces the need for sharp fiscal consolidation, but he is unlikely to want to do much about in advance of the 2018 election. The longer the delay, the worse things will get. Mugabe came to see that Zimbabwe needs to come out of its international isolation. He cleared arrears to the IMF and started a process with the World Bank. To regain access to capital flows, he needs to make progress on both the fiscal and the structural reform fronts. Trade compression needs to be unwound, which involves dealing with the unstable monetary situation.
And here is his dilemma: If he fails on the economic front, further deterioration in living standards is bound to follow. If he succeeds, then the proportion of people living in urban areas will rise, unless repressed once again, giving an advantage to the opposition. The politically optimum path might be to keep real GDP per capita constant or very slowly rising, but that outcome will be difficult to plan and the outcome would be highly uncertain. Mugabe failed to manage it consistently over the preceding two decades.
In these circumstances, the opposition’s best response is to position itself as a moderniser, pursuing rapid and inclusive economic growth, while championing human rights. This would require the acquisition and deployment of economic expertise, as well as monitoring and publication capabilities for dealing with infractions of human rights. Special attention would have to be paid to preventing splits.
Charles Simkins
Head of Research
charles@hsf.org.za
[1] [1] Afrobarometer is a pan-African, non-partisan research network that conducts public attitude surveys on democracy, governance, economic conditions, and related issues in more than 35 countries in Africa.

