
Reconciling policy and data
South Africa’s migration policy landscape contains some marked features:
- a control over rights-based approach to immigration;
- growing restriction, matched with growing temporary (and irregular) low-skilled migration;
- South Africa’s reluctance to translate its regional migration discourse into policy;
- an urgent skills drive to attract high-skilled immigrants and deter low-skilled ones; and
- a stubborn policy line, slow to respond to regional developments and national demands.
Drawing on the data, this brief pieces together a picture of migration in South Africa, determining the extent to which the policy regime has had its intended outcomes.
A major problem is that conclusions surrounding South African migration are limited by a lack of data. The Department of Home Affairs (DHA) has not published documented immigration data since 2015. Emigration data is characteristically difficult to capture, and although the 2016 Community Survey included questions aimed to determine emigration levels and trends, this dataset has not been made available to the public. Finally, undocumented or irregular migration is understood to make up a significant proportion of South Africa’s migration flows, of which there is no absolute measure.
Measuring migration [1]
Migration data is recorded in either stock or flows. Immigrant stock is the numbers of immigrants living in a country or region at a given point in time. Immigrant flows are the number of immigrants entering a region during a specified time period (e.g. over a year).
To get a clear picture of the migration landscape, it is useful to consider both types of data. Whereas flows give a sense of short-term arrivals, challenges and perceptions, stock gives a sense of the longer-term reality: how immigrants affect demographics, social integration and the economy. Immigration intensity measures the immigrant stock as a percentage of the local population at a point in time.
Emigrant flows are the number of migrants leaving South Africa in a given period, and stock is the number of South African-born people living outside of the country at a point in time. Refugee stock is the number of people with refugee status residing in a given region at a given time. Refugee flows are defined as first-time asylum claims – the number of people who enter a region and claim asylum irrespective of whether they are granted refugee status.
Question 1: How many immigrants are there in South Africa, and when did they arrive?
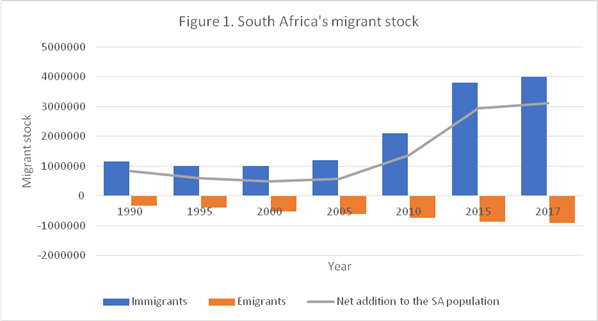
Source: International Organization for Migration
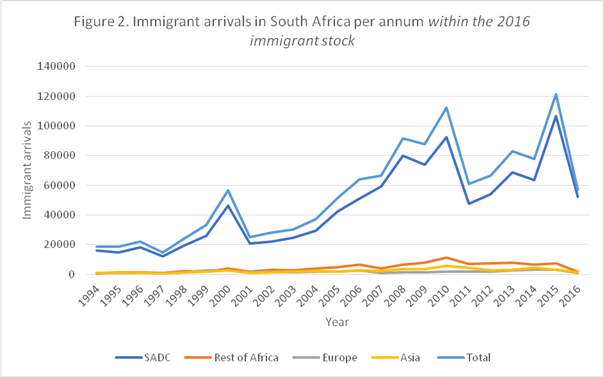
Source: Community Survey 2016
The graphs above paint two pictures. The first is of South Africa’s migrant stock at five-year intervals, supplied by the International Organisation for Migration (IOM) using UN population data. It tracks the increase in immigrants living within national borders since 2000, which has risen from 1 million to 4 million in 2017. The emigrant stock has also been increasing since 1990, but in recent years, not enough to offset immigration to any significant degree. Importantly, estimates of undocumented migration are included in this data, supplied by Statistics South Africa (Stats SA).[2]
There are no annual migrant stock data available, and the data that do exist does not distinguish between types of migrant. In response, the second graph presents 2016 Community Survey data on migration. In the survey, if a person in the sample indicated that a member of their household was not born in South Africa, they were asked that person was born and in what year they arrived. Thus Figure 2, which charts the immigrant arrivals per annum within the 2016 immigrant stock (i.e. those immigrants who were still alive and in South Africa in the year 2016).
Of course, the accuracy of the Community Survey is compromised by enumeration avoidance (illegal or fearful immigrants returning themselves in the census as South African to avoid detection) and self-naturalisation (integrated immigrants who have lived in South Africa for some time identifying as South African).
But there are some pronounced fluctuations worth attention:
- 1998 – 2001: Between 1998 and 2001 foreign arrivals to South Africa, particularly from the SADC, increased. This can be owed both to the end of apartheid – South Africa becoming a more attractive destination for SADC migrant workers – and to South Africa opening itself up to asylum-seekers through the 1998 Refugees Act. This coincided with mounting political and economic instability in the SADC region and the granting of three amnesties for undocumented SADC migrants between 1996 and 2002.
- 2001 – 2010: Between 2001 and 2010, annual arrivals increased fairly consistently. A portion of this increase can be attributed to the nature of the sample – the earlier immigrants arrived, the more likely they would have died or left by the time of the census. However, looked at with respect to Figure 1, the increase is an indication of the success of the 2002 Immigration Act in its “formalisation” of temporary immigration. Between 2000 and 2008, the DHA went from issuing 59 000 temporary work permits per annum, to 137 000.[3] Moreover, the DHA noted a remarkable increase in this period of asylum-seekers from, in order of extent, Zimbabwe, Ethiopia, Nigeria and the DRC (see Figure 4).[4]
- 2007 – 2011: The Dispensation of Zimbabweans Project was announced in 2010 in response to undocumented migration and the strained asylum system. Zimbabwean immigrants had until December that year to apply. In 2011, control and access were hardened with the 2011 Immigration Amendment Act and Refugees Amendment Act. The xenophobic violence of May 2008, killing 62 people and displacing 150 000, discouraged SADC arrivals between 2008 and 2009, but these were revived by opportunities presented by South Africa’s hosting of the 2010 FIFA World Cup.
- 2011 – 2015: SADC arrivals increased after 2011, particularly leading up to 2015. In July 2013, Mugabe gained a seventh term in office and political conflict flared. Because the DHA only records a slight increase in documented migrant flows in 2015 (see Figure 3) and the asylum channel was no longer open to Zimbabweans (see Figure 4), the Community Survey data point to an increase in undocumented migration during this time.
- 2015 – 2016: The dramatic decrease in SADC arrivals after 2015 is explicable by the decrease in asylum-seekers expressed in Figure 4 and by the 2016 Immigration Amendment Act – envisaged as a response to irregular migration. Although data are not available for 2017 and 2018, the subsequent 2017 Refugees Amendment Act supported by an increasingly securitised and anti-immigration government discourse (see 2016 Border Management Authority Bill and 2017 White Paper on International Migration), indicate that government has and will continue to curb migration – both documented and not.
Question 2: How are immigrants entering South Africa?
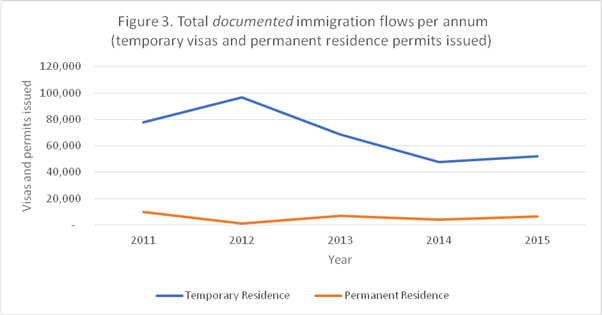
Source: Stats SA, Documented Immigrants in SA 2012 – 2015
*Temporary residence visas exclude visitors’ visas
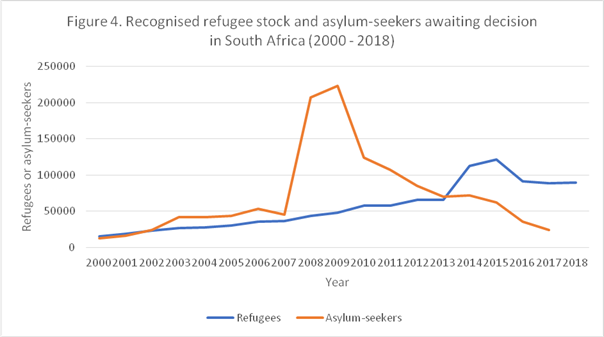
Sources: UNHCR Database (refugees) and DHA 2017-18 Annual Report (asylum, though contested[5])
Figure 3 indicates that over a decade of policies aimed at reducing documented low-skilled immigration has worked. In 2012, after the 2011 Immigration Amendment Act’s further qualification of eligibility for permanent work and business permits, only 1 283 permanent residence permits were issued. In the same year, temporary residence permits (now called “visas”) increased to 96 722. However, even the issuing of temporary permits has declined (reaching a peak of almost 140 000 in 2008), while permanent residence remains in the modest 1000-8000 permits per year bracket.
This is revealing when looked at against Figure 2, which records an increase in migrant arrivals to South Africa between 2011 and 2015. Between Figures 2 and 3, there are 62 826 arrivals unaccounted for in 2015 (subtracting the total permits issued by the DHA from the arrivals reported in the 2016 Community Survey). The DHA also reported 62 159 new applications for asylum made in 2015. Thus, the Community Survey indicates only 667 undocumented immigrants brave enough to admit that they were foreign-born. However, enumeration avoidance and the fact that the community survey only accounts for foreigners who were still in South Africa in 2016, means that the problem is larger.
Although conclusive data is not available, Stats SA estimates that undocumented immigration stock increased by over 100% between 2011 and 2015, to between 500 000 and one million people. Before the introduction of the Dispensation of Zimbabweans Project in 2010, annual deportations exceeded 250 000. Between January 2012 and December 2016, 369 726 migrants were deported – nationals from Mozambique, Zimbabwe and Lesotho made up 88% of the deportations. Illegal immigration is reported to have decreased in recent years, but any level of reliance on policing and deportation is inefficient.
Source: Stats SA, Documented Immigrants in SA 2012 – 2015
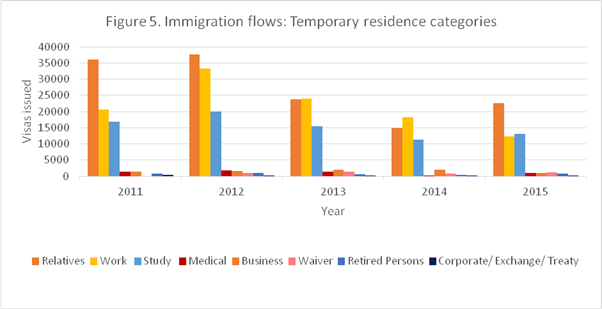
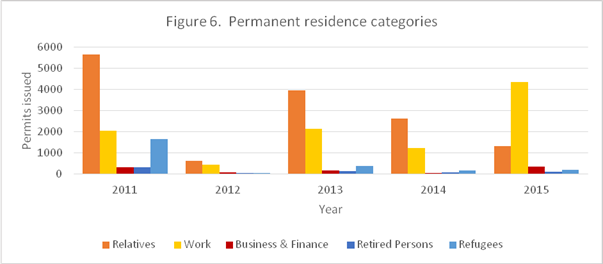
The DHA has published information regarding the types of residence permit issued between 2011 and 2015, graphed above. In both categories, permits granted to relatives have decreased over the period. Reaching a peak in 2012, temporary work and study visas have also experienced a decline. The only significant upward trend in the period was that of permanent residence for workers, reaching a peak of a mere 4354 permits issued in 2015.
Question 3: Where are immigrants coming from?
*Vistors’ visas are not included in these graphs
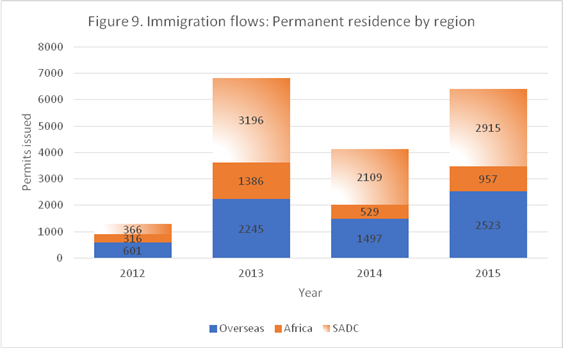
Source: Stats SA, Documented Immigrants in SA 2012 – 2015
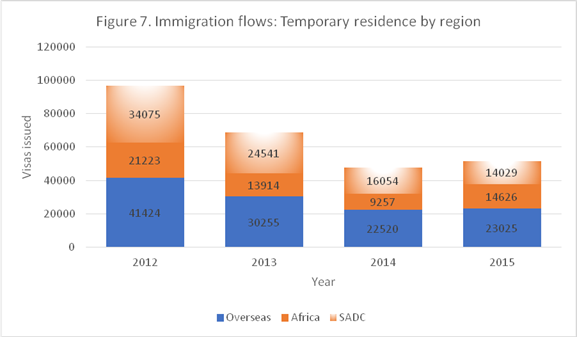
The regional composition of immigration flows expressed above are inconsistent with the arrivals reported in Figure 2. Figure 2 indicates that in 2016, the immigration stock was dictated almost entirely by arrivals from the SADC. This would certainly be in line with the government discourse and regional commitments. However, Figure 7 shows that in each year, documented SADC nationals have never received more than 36% of temporary and 51% of permanent permits.
There are some reasonable explanations:
- SADC people – mainly Zimbabweans – have remained in South Africa, while overseas and other African leave after a short time, thus not featuring in the 2016 Community Survey
- SADC people are often asylum-seekers
- SADC people are often undocumented
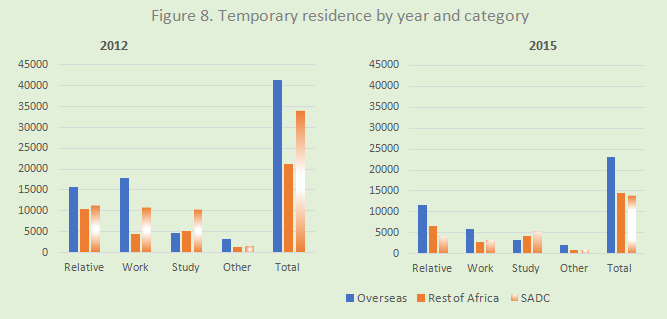
The portion of temporary residence visas issued to SADC migrants has decreased over the period, as fewer Zimbabweans are admitted. Meanwhile, temporary migration from Nigeria and the DRC has increased over the period, keeping the overall portion of temporary residence visas issued to Africans constant at 55%. Around 45% of the temporary residence visas issued in each year have gone to immigrants from outside Africa.
There have been altogether fewer temporary work, study, relatives and other visas issued over the period. This is reflective of the government stance and an implication of the restrictive 2011 Immigration Amendment Act. This observation could either be seen as positive, in that temporary African immigration (perpetuating exploitative “colonial patterns”) decreased during the period, or that it was merely pushed further into irregularity. Figure 2 – showing an increase in SADC arrivals after 2011 – suggests the latter.
The permanent residence permit data contains large fluctuations in the volume and ratio of SADC and other immigrants. Permits issued each year ranged from 1300 to 6900 – modest even at their 2013 peak. Compared with the 50 000 to 100 000 range in temporary visas, the preference for temporary migration is evident. Moreover, the government’s pro-Africa and SADC stance is not convincingly reflected in the data.
Question 4: What of emigration, the demographics of migration and the brain drain?
|
1990 |
2000 |
2010 |
2017 |
|
|
Emigrant stocks |
327 700 |
512 300 |
740 300 |
898 400 |
|
Emigrant Intensity |
<1% |
1% |
1% |
2% |
|
Immigrant stocks |
1.16 million |
1 million |
2.1 million |
4 million |
|
Immigrant Intensity |
3% |
2% |
4% |
7% |
Source: IOM, using UN World Population Prospects[6]
Interpreting emigration from South Africa is difficult without a headcount. UN data shows that South African emigration stocks have increased almost annually since 1990. One way to determine emigration rates is through industry surveys. The FNB property barometer ascertains why homeowners are selling, buying and upscaling or downscaling their homes, emigration being one of the tracked metrics. Emigration as a reason for selling climbed from 4.6% in 2016 to 7.4% in 2018, indicating that emigration rates (beyond those recorded by the UN to date) are rising rapidly.[7]
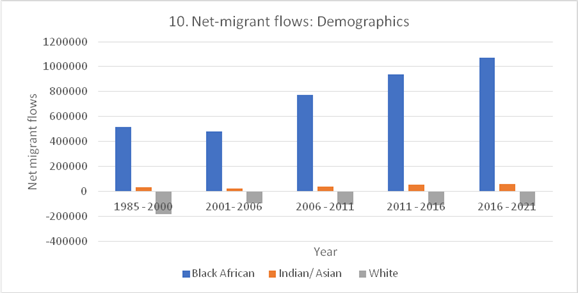
Source: Stats SA 2018 Mid-year population estimates
According to Stats SA, 612 000 white South Africans left the country between 1985 and 2021, 430 000 (70%) of them in the 20 years leading up to 2021. The white proportion of the population is shrinking. while the black proportion is increasing year on year, both with African immigration and high birth rates.
It is difficult to quantify the “brain drain”, but there is no doubt that highly skilled wealthy individuals are emigrating at higher rates. The Frank Knight Wealth Report of 2018 showed that between 2012 and 2017, South Africa lost almost a quarter of its super wealthy individuals (those with a net worth of over $5 million), dropping from 13 380 to 10 350 in five years. This is not attributed exclusively to emigration, as South Africa’s ailing economy has destroyed substantial wealth.
Clearly the skills drive, with which migration policy has been preoccupied since its post-democratic inception, is vital. The question is whether increasingly narrow critical skills and business visas (designed to prevent unskilled immigration with every new Immigration Act amendment) are performing their function.
After the 2011 Immigration Amendment Act, applicants trying to obtain a business visa were required to invest a minimum of R5 million in the South African economy, originating from outside the country. This is five times the amount required in countries such as Singapore.[8] In response, in 2011, 1679 business visas were issued. This increased to 2087 in 2012 and 2044 in 2013, and then declined to 1261 in 2015.[9]
The DHA’s proposed slash in the critical skills list, announced in 2018, omits a number of key skills including ‘corporate general manager’, foreign language skills, data scientists and AI specialists. According to immigration expert Stefanie de Saude-Darbandi, the DHA ‘notorious for their own interpretations of immigration law, now appear to be pre-emptively clamping down on immigration across the board’. Given the positive economic contribution of immigrants concluded in the first brief, this is expected to have a negative impact on FDI and GDP.[10]
Conclusion
There is a pressing need for more comprehensive and conclusive data on immigration, emigration and asylum, published by the DHA annually, coherently and accessibly. This will have an effect on both uninformed xenophobic sentiment and on illuminating the issue of migration policy’s unresponsiveness to regional developments and national demands.
Despite data gaps, some inferences can be made about South African migration and policy outcomes. The first is that the DHA’s preoccupation with restrictionism seems to have compromised not only permanent and low-skilled immigration as intended, but temporary and skills-based migration – two inroads for immigrants that are vital to economic growth. Although data is not conclusive, undocumented migration appears to have risen to satisfy some of the demand for low-skilled workers. Failure to accommodate migration pressures from neighbouring countries will result in a rise of undocumented migrants.
South Africa has not successfully translated its regional migration discourse into reality, in that non-African migrants continued to make up around 45% of newcomers and SADC documented inflows decreased during the period under study. Asylum levels look to have declined to pre-crisis levels, and the DHA must take full responsibility for chronic processing delays. Policies designed to attract and retain skilled and entrepreneurial immigrants and locals are vital to the future of the economy.
Tove van Lennep
Researcher
tove@hsf.org.za
[1] Helen Suzman Foundation, June 2019. What is New about the European Migrant Crisis.
[2] Business Day, 25 March 2019. ANC lacks coherent policy for deluge of undocumented migrants.
[3] Crush, J. 2011. ‘Complex Movements, Confused Responses: Labour Migration in South Africa’ in South African Migration Programme Policy Brief, no 25, August 2011, p12 – 14.
[4] PMG, 8 March 2016. Asylum statistics: Department Home Affairs briefing; Immigration Amendment Bill 2016 deliberations
[5] Africa Check, 15 August 2016. Is South Africa home to more than a million asylum seekers? The numbers don’t add up
[6] Emigrant intensity is equal to emigrant stocks over domestic population in a given year. Immigrant intensity is equal to immigrant stocks (foreign-born population) over domestic population in a given year. Net international migration estimates are derived using not only Census 2011 migration data, but also migration numbers and proportions from various other authors, methods and data sources such as the International Organisation for Migration (IOM), Organisation for Economic Co-operation and Development (OECD) which form part of the UN network as well as census data from National statistics offices (NSO) of various countries.
[7] Business Tech, 28 August 2018. 4 real facts about emigration in South Africa
[8] Business Tech, 5 November 2018. Major immigration law changes to hit South Africa hard: expert
[9] Stats SA, Documented Immigrants in SA (2012 – 2015)
[10] Business Tech, 5 November 2018. Major immigration law changes to hit South Africa hard: expert

